MOTOSHARE 🚗🏍️
Rent Bikes & Cars Directly from Owners
Motoshare connects vehicle owners with people who need bikes and cars on rent. Owners earn from idle vehicles, and renters get flexible ride options.
Visit Motoshare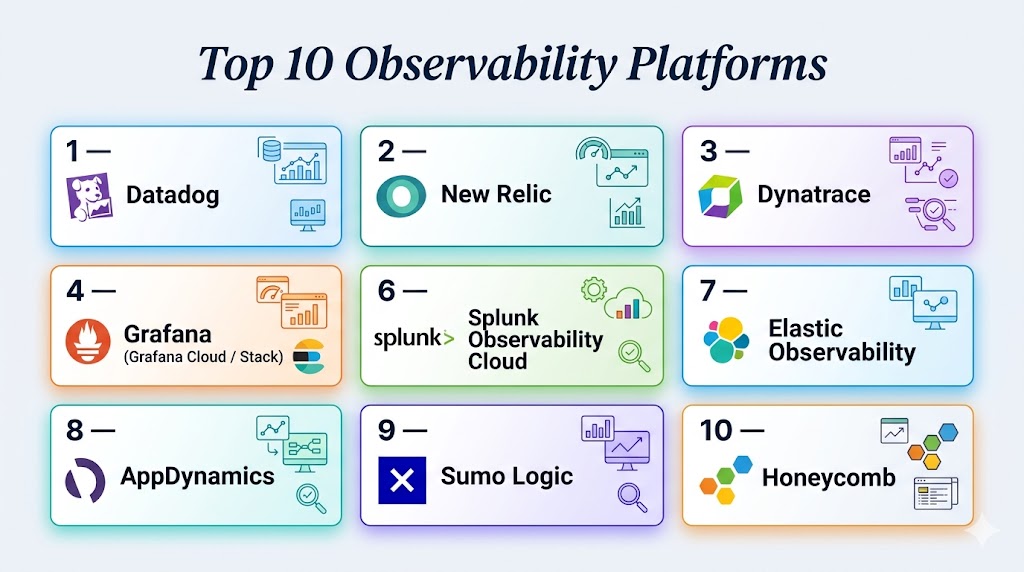
Introduction
Modern systems are no longer simple—they’re distributed, dynamic, and constantly changing. That’s where Observability Platforms come in. These tools help teams see inside complex systems by analyzing metrics, logs, and traces in real time—so you don’t just detect issues, you understand them.
In today’s DevOps and cloud-native world, downtime is expensive and user expectations are high. Observability has become a core engineering capability, not a luxury. Whether you’re running microservices, Kubernetes clusters, or global SaaS platforms, you need deep visibility to stay ahead.
Real-world use cases:
- Debugging production issues in distributed systems
- Monitoring application performance and uptime
- Detecting anomalies before users notice
- Optimizing infrastructure and cloud spend
- Improving user experience through real-time insights
What buyers should evaluate:
- Full support for metrics, logs, and traces (MELT)
- Real-time alerting and anomaly detection
- AI-driven insights and automation
- Cloud-native and Kubernetes support
- Integration ecosystem (DevOps, cloud, APIs)
- Scalability for high-volume data
- Ease of setup and usability
- Visualization and dashboards
- Security and access control
- Pricing based on data ingestion
Best for: DevOps teams, SREs, platform engineers, and fast-scaling SaaS companies that need deep visibility into complex systems.
Not ideal for: Small projects or static applications where basic monitoring tools are enough.
Key Trends in Observability Platforms
- AI-powered root cause analysis is replacing manual debugging
- OpenTelemetry is becoming the default standard for telemetry collection
- Unified platforms are replacing fragmented monitoring stacks
- Shift toward real-time observability instead of reactive monitoring
- Cloud-native focus with Kubernetes-first architectures
- Observability + security convergence (DevSecOps alignment)
- Cost-aware observability to control data explosion
- Self-service dashboards empowering non-SRE teams
- Event-driven observability for high-cardinality data
- Platform engineering adoption driving standardized observability stacks
How We Selected These Tools (Methodology)
- Prioritized tools with strong market adoption and credibility
- Evaluated end-to-end observability capabilities (logs, metrics, traces)
- Assessed real-world performance and scalability
- Reviewed AI and automation features
- Considered security and compliance readiness
- Analyzed integration ecosystems and extensibility
- Checked developer and operator experience
- Included both open-source and enterprise tools
- Evaluated support quality and community strength
- Ensured coverage across SMB to enterprise use cases
Top 10 Observability Platforms
#1 — Datadog
Short description: A powerhouse in cloud observability, Datadog delivers full-stack monitoring with deep integrations and real-time analytics for modern infrastructure.
Key Features
- Unified metrics, logs, and traces
- Real-time dashboards and alerts
- AI-driven anomaly detection
- Infrastructure and APM monitoring
- Security monitoring integration
- Cloud-native visibility
Pros
- Extremely comprehensive platform
- Massive integration ecosystem
Cons
- Pricing can escalate quickly
- Requires tuning for cost optimization
Platforms / Deployment
Web / Cloud
Security & Compliance
SSO, RBAC, encryption (others not publicly stated)
Integrations & Ecosystem
Datadog connects seamlessly across modern stacks, making it a central observability hub.
- AWS, Azure, GCP
- Kubernetes
- CI/CD tools
- APIs
Support & Community
Strong enterprise support with extensive documentation.
#2 — New Relic
Short description: A developer-friendly observability platform offering powerful APM, analytics, and full-stack visibility.
Key Features
- Application performance monitoring
- Distributed tracing
- Log management
- Real-time analytics
- AI insights
Pros
- Strong APM capabilities
- Flexible usage-based pricing
Cons
- UI can feel overwhelming
- Data costs require monitoring
Platforms / Deployment
Web / Cloud
Security & Compliance
SSO, RBAC (others not publicly stated)
Integrations & Ecosystem
- Kubernetes
- Cloud platforms
- APIs
- DevOps tools
Support & Community
Large ecosystem and strong developer adoption.
#3 — Dynatrace
Short description: An enterprise-grade observability platform powered by advanced AI for automatic insights and root cause analysis.
Key Features
- Automatic dependency mapping
- AI-driven root cause detection
- Full-stack monitoring
- Kubernetes and cloud support
- Digital experience monitoring
Pros
- Industry-leading AI capabilities
- Highly scalable
Cons
- Premium pricing
- Learning curve
Platforms / Deployment
Cloud / Hybrid
Security & Compliance
SSO, RBAC (others not publicly stated)
Integrations & Ecosystem
- Cloud providers
- Kubernetes
- APIs
Support & Community
Enterprise-level support and onboarding.
#4 — Grafana (Grafana Cloud / Stack)
Short description: The go-to platform for visualization and dashboards, widely used with open-source observability stacks.
Key Features
- Custom dashboards
- Multi-source data integration
- Alerting system
- Plugin ecosystem
- OpenTelemetry support
Pros
- Highly flexible and customizable
- Strong open-source community
Cons
- Requires setup with other tools
- Not fully unified alone
Platforms / Deployment
Web / Cloud / Self-hosted
Security & Compliance
RBAC (others not publicly stated)
Integrations & Ecosystem
- Prometheus
- Elasticsearch
- Cloud tools
- APIs
Support & Community
Massive community and plugin ecosystem.
#5 — Prometheus
Short description: A powerful open-source metrics monitoring system built for cloud-native environments.
Key Features
- Time-series database
- Metrics collection
- Alerting system
- Kubernetes-native support
- Query language (PromQL)
Pros
- Highly scalable
- Free and open-source
Cons
- Limited visualization
- Requires additional tools
Platforms / Deployment
Self-hosted
Security & Compliance
Varies / Not publicly stated
Integrations & Ecosystem
- Kubernetes
- Grafana
- APIs
Support & Community
Very strong open-source adoption.
#6 — Splunk Observability Cloud
Short description: Enterprise-grade observability with deep log analytics and real-time insights.
Key Features
- Log analytics
- APM and infrastructure monitoring
- Real-time dashboards
- AI insights
- Security integration
Pros
- Strong analytics capabilities
- Enterprise-ready
Cons
- Expensive
- Complex deployment
Platforms / Deployment
Cloud
Security & Compliance
SSO, RBAC (others not publicly stated)
Integrations & Ecosystem
- Cloud providers
- APIs
- DevOps tools
Support & Community
Enterprise support and ecosystem.
#7 — Elastic Observability
Short description: Built on the ELK stack, Elastic provides flexible observability for logs, metrics, and traces.
Key Features
- Log analytics
- Metrics and tracing
- Machine learning insights
- Custom dashboards
- Open-source foundation
Pros
- Highly flexible
- Strong log analysis
Cons
- Setup complexity
- Resource-intensive
Platforms / Deployment
Cloud / Self-hosted
Security & Compliance
RBAC (others not publicly stated)
Integrations & Ecosystem
- Elasticsearch
- Beats
- APIs
Support & Community
Strong community and enterprise support.
#8 — AppDynamics
Short description: A business-focused APM platform that connects performance metrics with business outcomes.
Key Features
- Application monitoring
- Business transaction tracking
- Root cause analysis
- Real-time alerts
- Cloud monitoring
Pros
- Strong enterprise focus
- Business insights
Cons
- High cost
- Complex setup
Platforms / Deployment
Cloud / On-premises
Security & Compliance
SSO, RBAC (others not publicly stated)
Integrations & Ecosystem
- Cloud platforms
- APIs
Support & Community
Enterprise support.
#9 — Sumo Logic
Short description: Cloud-native observability platform combining logs, metrics, and security analytics.
Key Features
- Log analytics
- Cloud monitoring
- Machine learning insights
- Real-time dashboards
- Security analytics
Pros
- Scalable cloud architecture
- Strong analytics
Cons
- Learning curve
- Pricing complexity
Platforms / Deployment
Cloud
Security & Compliance
SSO, RBAC (others not publicly stated)
Integrations & Ecosystem
- AWS, Azure
- Kubernetes
- APIs
Support & Community
Good documentation and support.
#10 — Honeycomb
Short description: A developer-first observability platform built for debugging complex distributed systems.
Key Features
- High-cardinality data analysis
- Distributed tracing
- Event-based observability
- Real-time querying
- Debugging tools
Pros
- Excellent debugging capabilities
- Developer-focused
Cons
- Niche use cases
- Learning curve
Platforms / Deployment
Cloud
Security & Compliance
Not publicly stated
Integrations & Ecosystem
- OpenTelemetry
- APIs
Support & Community
Growing ecosystem.
Comparison Table (Top 10)
| Tool Name | Best For | Platform(s) Supported | Deployment | Standout Feature | Public Rating |
|---|---|---|---|---|---|
| Datadog | Full-stack observability | Web | Cloud | Unified platform | N/A |
| New Relic | APM + analytics | Web | Cloud | Developer-friendly | N/A |
| Dynatrace | AI-driven insights | Web | Cloud/Hybrid | Root cause AI | N/A |
| Grafana | Visualization | Web | Cloud/Self-hosted | Dashboards | N/A |
| Prometheus | Metrics monitoring | Linux/Web | Self-hosted | Time-series DB | N/A |
| Splunk | Enterprise analytics | Web | Cloud | Log analytics | N/A |
| Elastic | Log + metrics | Web | Cloud/Self-hosted | ELK stack | N/A |
| AppDynamics | Business APM | Web | Cloud/On-prem | Business insights | N/A |
| Sumo Logic | Cloud logs | Web | Cloud | ML analytics | N/A |
| Honeycomb | Debugging | Web | Cloud | Event-based analysis | N/A |
Evaluation & Scoring of Observability Platforms
| Tool Name | Core | Ease | Integrations | Security | Performance | Support | Value | Weighted Total |
|---|---|---|---|---|---|---|---|---|
| Datadog | 9 | 7 | 10 | 8 | 9 | 9 | 7 | 8.6 |
| New Relic | 9 | 7 | 9 | 8 | 9 | 9 | 8 | 8.7 |
| Dynatrace | 10 | 7 | 9 | 9 | 10 | 9 | 6 | 8.8 |
| Grafana | 8 | 7 | 9 | 7 | 8 | 9 | 9 | 8.3 |
| Prometheus | 8 | 6 | 8 | 6 | 9 | 8 | 10 | 8.0 |
| Splunk | 9 | 6 | 9 | 9 | 9 | 9 | 6 | 8.4 |
| Elastic | 8 | 6 | 8 | 7 | 8 | 8 | 8 | 7.9 |
| AppDynamics | 9 | 6 | 8 | 9 | 9 | 9 | 6 | 8.3 |
| Sumo Logic | 8 | 7 | 8 | 8 | 8 | 8 | 7 | 7.9 |
| Honeycomb | 8 | 7 | 7 | 7 | 8 | 7 | 7 | 7.6 |
How to interpret scores:
These scores are comparative—not absolute. A higher score indicates stronger overall capability across weighted criteria. Enterprises should prioritize scalability and AI, while startups may focus on cost and simplicity. Always align scoring with your real-world use case.
Which Observability Platform Is Right for You?
Solo / Freelancer
Go with Grafana + Prometheus for a cost-effective and flexible setup.
SMB
Choose New Relic or Sumo Logic for balance between usability and power.
Mid-Market
Datadog or Elastic offer scalability and strong integrations.
Enterprise
Dynatrace, Splunk, and AppDynamics are built for large-scale environments.
Budget vs Premium
- Budget: Prometheus, Grafana
- Premium: Datadog, Dynatrace
Feature Depth vs Ease of Use
- Advanced: Dynatrace, Splunk
- Easy: New Relic
Integrations & Scalability
Datadog and New Relic lead in ecosystem depth.
Security & Compliance Needs
Enterprise users should prioritize tools with RBAC, encryption, and audit capabilities.
Frequently Asked Questions (FAQs)
1. What is an observability platform?
A platform that collects and analyzes system data (metrics, logs, traces) to understand system behavior.
2. What are the three pillars of observability?
Metrics, logs, and traces form the foundation of observability.
3. How is observability different from monitoring?
Monitoring tells you something is wrong; observability helps you understand why.
4. Are observability tools expensive?
Yes, especially at scale due to data ingestion costs.
5. Can startups use observability tools?
Yes, many tools offer free tiers or open-source options.
6. What is OpenTelemetry?
An open standard for collecting telemetry data across systems.
7. Do these tools support Kubernetes?
Yes, most modern platforms are Kubernetes-native.
8. What are common mistakes?
Collecting too much data without cost control or clear goals.
9. Can multiple tools be combined?
Yes, many teams use hybrid observability stacks.
10. Are these tools secure?
Security varies; check RBAC, encryption, and compliance features.
Conclusion
Observability platforms are no longer optional—they are essential for running modern, distributed systems with confidence. As architectures become more complex, the ability to gain deep, real-time insights into system behavior directly impacts performance, reliability, and user satisfaction. The tools covered in this guide range from flexible open-source solutions to powerful enterprise platforms with AI-driven automation. There is no single “best” option—only the one that fits your architecture, team maturity, and budget. Focus on integration, scalability, and ease of use when making your decision. The smartest next step is to shortlist a few platforms, run a pilot in your environment, and validate how effectively they surface insights, reduce downtime, and improve operational efficiency.
Nice comparison of observability platforms. One thing often missed in real environments is the challenge of managing data overload—collecting metrics, logs, and traces is easy, but turning them into actionable insights without increasing cost and alert fatigue is much harder.
A practical gap is telemetry ownership after the platform is chosen. Teams should define who owns dashboards, alerts, labels, sampling rules, and stale signals; otherwise observability slowly turns into noisy data collection instead of reliable production insigh