MOTOSHARE 🚗🏍️
Rent Bikes & Cars Directly from Owners
Motoshare connects vehicle owners with people who need bikes and cars on rent. Owners earn from idle vehicles, and renters get flexible ride options.
Visit Motoshare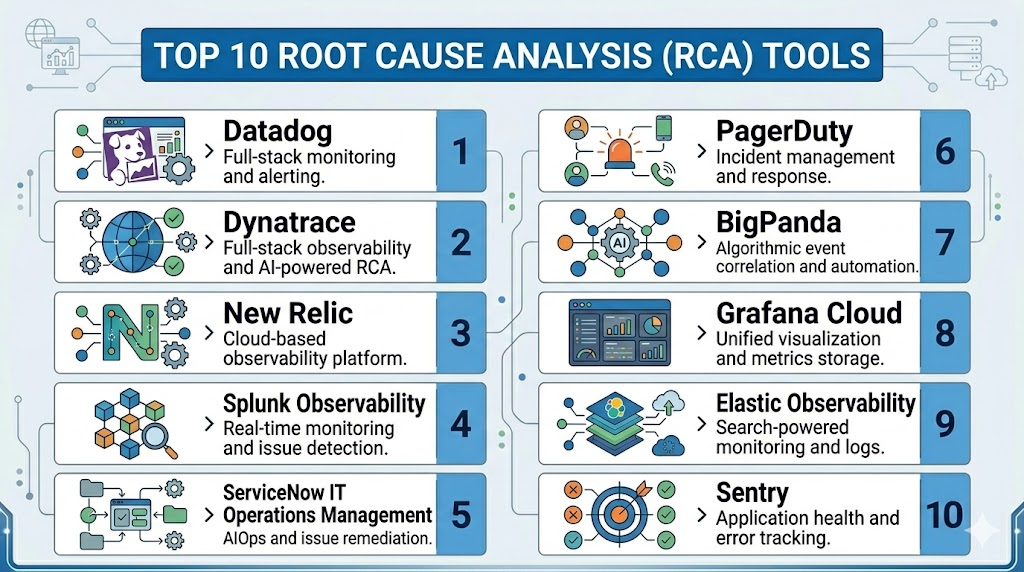
Introduction
Root Cause Analysis RCA tools help teams understand why a problem happened, not just what went wrong on the surface. In software, IT operations, DevOps, manufacturing, customer support, and enterprise service management, RCA tools collect signals from alerts, logs, traces, incidents, workflows, user reports, and system events to identify the real source of failure. This matters now because modern systems are distributed, cloud-based, API-heavy, and increasingly automated. A single outage may involve infrastructure, code changes, third-party services, security events, configuration drift, or user behavior.Real-world use cases include incident investigation, application performance troubleshooting, IT service desk problem management, cloud outage diagnosis, security incident correlation, and post-incident learning. Buyers should evaluate data correlation, AI-assisted analysis, observability depth, incident workflow support, integrations, auditability, deployment model, scalability, ease of adoption, and security controls.
Best for: RCA tools are best for DevOps teams, SRE teams, IT operations teams, security operations teams, platform engineers, support leaders, and enterprises that need faster incident investigation, lower downtime, and better prevention of recurring problems.
Not ideal for: Very small teams with simple systems may not need a dedicated RCA platform. Basic ticketing, spreadsheets, monitoring alerts, or manual postmortem templates may be enough when incident volume is low and system complexity is limited.
Key Trends in Root Cause Analysis RCA Tools
- AI-assisted incident diagnosis is becoming a major feature, helping teams correlate events, logs, traces, alerts, and topology data faster.
- AIOps adoption is growing as organizations try to reduce alert noise and identify likely root causes automatically.
- Observability-first RCA is now common, especially for cloud-native teams using metrics, logs, traces, service maps, and real-user monitoring.
- Incident workflow automation is becoming important, with tools connecting RCA findings to escalation, remediation, runbooks, and postmortems.
- Service dependency mapping is more valuable because microservices, APIs, containers, and multi-cloud systems create complex failure chains.
- Blameless postmortems are becoming standard, shifting RCA from individual fault-finding to system improvement.
- Security and compliance expectations are rising, especially around audit logs, role-based access, SSO, encryption, and data retention.
- Integrations with collaboration tools such as Slack, Microsoft Teams, Jira, GitHub, ServiceNow, and CI/CD systems are now expected.
- Hybrid deployment needs remain important for regulated industries that want cloud convenience but also require stronger governance.
- Usage-based pricing scrutiny is increasing because observability and log ingestion costs can grow quickly at scale.
How We Selected These Tools Methodology
The Top 10 tools were selected using the following evaluation logic:
- Market adoption and mindshare across DevOps, SRE, IT operations, observability, and incident management teams.
- Feature completeness for RCA workflows, including monitoring, alert correlation, service mapping, anomaly detection, and incident review.
- Reliability and performance signals based on fit for high-volume enterprise environments.
- Security posture signals such as access control, auditability, enterprise authentication, and compliance readiness where publicly known.
- Integrations and ecosystem strength with cloud platforms, ITSM tools, incident tools, communication apps, and developer workflows.
- Customer fit across segments, including startups, SMBs, mid-market companies, and enterprises.
- AI and automation maturity, especially for event correlation, anomaly detection, noise reduction, and guided investigation.
- Ease of implementation, including onboarding complexity, learning curve, and operational overhead.
- Post-incident workflow support, including postmortems, problem management, and prevention of recurring issues.
- Balanced category coverage, including observability platforms, AIOps tools, incident response tools, and IT operations platforms.
Top 10 Root Cause Analysis RCA Tools
#1 — Datadog
Short description:
Datadog is a cloud-based observability and monitoring platform used by DevOps, SRE, cloud operations, and platform teams. It helps teams investigate incidents by connecting metrics, logs, traces, real-user data, infrastructure events, alerts, dashboards, and service dependencies. For RCA, Datadog is especially useful when teams need a unified view across cloud infrastructure, applications, containers, databases, and third-party services. It is best suited for cloud-native teams that want monitoring, alerting, anomaly detection, and troubleshooting in one platform.
Key Features
- Unified metrics, logs, traces, APM, infrastructure monitoring, and synthetic monitoring.
- Service maps and dependency views for understanding failure chains.
- Anomaly detection and alert correlation for faster issue identification.
- Dashboards and notebooks for investigation and incident review.
- Cloud, container, Kubernetes, database, and network monitoring support.
- Incident management capabilities for response coordination.
- Strong ecosystem of integrations with cloud and DevOps tools.
Pros
- Strong all-in-one observability coverage for modern cloud environments.
- Useful for teams that need fast troubleshooting across infrastructure and applications.
- Large integration ecosystem supports complex enterprise stacks.
Cons
- Costs can increase as data volume, hosts, logs, and retention needs grow.
- Feature depth can create a learning curve for smaller teams.
- Requires careful configuration to avoid noisy alerts and dashboard clutter.
Platforms / Deployment
Web / iOS / Android
Cloud
Security & Compliance
Datadog commonly supports enterprise security controls such as SSO/SAML, MFA, RBAC, encryption, and audit logs. Specific compliance availability may depend on product plan, region, and contract. Certifications should be verified directly during procurement.
Integrations & Ecosystem
Datadog has a broad integration ecosystem, making it suitable for teams that need RCA across infrastructure, applications, databases, cloud services, CI/CD tools, and collaboration platforms.
- AWS, Microsoft Azure, Google Cloud
- Kubernetes, Docker, serverless platforms
- Slack, Microsoft Teams, Jira, PagerDuty
- GitHub, GitLab, CI/CD pipelines
- Databases, queues, caches, and network tools
- APIs and custom instrumentation
Support & Community
Datadog provides documentation, learning resources, onboarding support, enterprise support plans, and a large user community. Support depth may vary by plan and contract size.
#2 — Dynatrace
Short description:
Dynatrace is an enterprise observability and AIOps platform known for automatic discovery, dependency mapping, performance monitoring, and AI-assisted root cause analysis. It is often used by large organizations that need deep visibility across applications, infrastructure, cloud platforms, Kubernetes, user experience, and business services. Dynatrace is strong for RCA because it focuses on connecting symptoms to impacted services and likely causes. It is especially useful for enterprises with complex, distributed, and hybrid environments.
Key Features
- Automatic discovery of applications, services, processes, and infrastructure.
- AI-assisted problem detection and root cause analysis.
- Distributed tracing and dependency mapping.
- Full-stack observability across cloud, hybrid, and container environments.
- Digital experience monitoring for user impact analysis.
- Kubernetes and cloud-native monitoring.
- Business service impact views for prioritizing incidents.
Pros
- Strong automation reduces manual configuration in complex environments.
- Good fit for enterprises that need deep dependency visibility.
- Useful for identifying service impact and likely root causes quickly.
Cons
- Can be expensive for smaller teams or narrow use cases.
- Advanced configuration may require experienced observability teams.
- Some teams may find the platform broad if they only need basic RCA.
Platforms / Deployment
Web
Cloud / Hybrid
Security & Compliance
Dynatrace provides enterprise security capabilities such as access control, SSO options, encryption, and audit-related features. Specific compliance certifications and availability should be confirmed during vendor review.
Integrations & Ecosystem
Dynatrace integrates with major cloud platforms, ITSM tools, DevOps workflows, alerting systems, and automation platforms. It is designed for enterprise ecosystems where many tools contribute to incident context.
- AWS, Microsoft Azure, Google Cloud
- Kubernetes, OpenShift, VMware, containers
- ServiceNow, Jira, PagerDuty
- CI/CD and deployment tools
- OpenTelemetry and observability standards
- APIs and automation workflows
Support & Community
Dynatrace offers enterprise documentation, training, support services, and professional services. Community strength is solid among enterprise observability and AIOps users.
#3 — New Relic
Short description:
New Relic is an observability platform used by engineering, DevOps, and SRE teams to monitor applications, infrastructure, logs, traces, browser experience, mobile apps, and service health. For RCA, New Relic helps teams investigate performance issues, detect anomalies, connect telemetry data, and understand how application behavior affects users. It is a strong fit for software teams that want developer-friendly observability and practical incident investigation. New Relic is often selected by teams that need faster application troubleshooting without building many separate monitoring workflows.
Key Features
- Application performance monitoring and distributed tracing.
- Logs, metrics, infrastructure, browser, mobile, and synthetic monitoring.
- Service maps and dependency analysis.
- Anomaly detection and alerting.
- Dashboards and query-based analysis.
- Incident and alert workflow support.
- Developer-friendly telemetry and OpenTelemetry support.
Pros
- Strong application-focused RCA for engineering teams.
- Good usability for developers and DevOps users.
- Helpful for connecting performance symptoms to code, services, and infrastructure.
Cons
- Pricing and data usage must be monitored carefully at scale.
- Enterprise-level governance may require plan review.
- Teams with heavy ITSM workflows may need additional integrations.
Platforms / Deployment
Web / iOS / Android
Cloud
Security & Compliance
New Relic generally offers enterprise controls such as SSO, role-based access, audit-related capabilities, and encryption. Compliance details should be verified directly based on region, plan, and contract.
Integrations & Ecosystem
New Relic integrates with development, cloud, observability, incident, and collaboration tools, making it practical for teams that want RCA inside engineering workflows.
- AWS, Azure, Google Cloud
- Kubernetes, Docker, serverless platforms
- Slack, Microsoft Teams, Jira, PagerDuty
- GitHub, GitLab, CI/CD tools
- OpenTelemetry and APIs
- Databases, queues, and infrastructure services
Support & Community
New Relic provides product documentation, learning content, support plans, and community resources. It is widely used by developer and DevOps communities.
#4 — Splunk Observability Cloud
Short description:
Splunk Observability Cloud helps teams monitor and troubleshoot applications, infrastructure, logs, metrics, traces, and user experience. It is often used by organizations that already rely on Splunk for logging, security analytics, or IT operations. For RCA, Splunk is valuable because it can connect high-volume machine data, observability signals, events, and service health insights. It is best suited for enterprises that need powerful search, analytics, and operational visibility across complex environments.
Key Features
- Metrics, logs, traces, infrastructure, and application monitoring.
- Real-time analytics for high-volume operational data.
- Service monitoring and dependency visibility.
- Dashboards and alerting for incident investigation.
- Strong log analytics and search capabilities.
- Support for cloud, hybrid, and enterprise environments.
- Ecosystem alignment with Splunk security and IT operations products.
Pros
- Strong for organizations with large data volumes and complex environments.
- Useful when RCA requires deep log search and operational analytics.
- Good fit for enterprises already invested in Splunk.
Cons
- Can require skilled administrators for advanced use.
- Cost management can be challenging with large data ingestion.
- Smaller teams may find it more complex than lightweight tools.
Platforms / Deployment
Web
Cloud / Hybrid
Security & Compliance
Splunk generally supports enterprise security capabilities such as access controls, encryption, audit logs, and SSO options. Specific compliance certifications and feature availability should be confirmed directly.
Integrations & Ecosystem
Splunk has a mature ecosystem across IT operations, security, observability, cloud, and enterprise systems. It is strong where RCA depends on combining many machine-data sources.
- AWS, Azure, Google Cloud
- Kubernetes and container environments
- ServiceNow, Jira, PagerDuty
- Security tools and SIEM workflows
- APIs, forwarders, and data connectors
- Splunk IT operations and security products
Support & Community
Splunk has extensive documentation, training, partner services, enterprise support, and a large professional community. Support levels vary by contract.
#5 — ServiceNow IT Operations Management
Short description:
ServiceNow IT Operations Management is designed for enterprise IT teams that need event management, service visibility, AIOps, discovery, operational intelligence, and workflow automation. For RCA, ServiceNow is valuable when incidents need to be connected with CMDB data, service maps, ITSM tickets, change records, business services, and automated remediation. It is especially useful for large enterprises that want RCA to be part of a broader IT service management and operations workflow. It is not just a monitoring tool; it is an enterprise operations platform.
Key Features
- Event management and alert correlation.
- Service mapping and CMDB-connected context.
- AIOps capabilities for noise reduction and probable cause analysis.
- Integration with ITSM incident, problem, and change workflows.
- Discovery for infrastructure and service relationships.
- Workflow automation and remediation support.
- Business service impact analysis.
Pros
- Strong fit for ITIL, ITSM, and enterprise operations teams.
- Connects RCA with incident, problem, change, and service management.
- Useful for regulated and large-scale IT organizations.
Cons
- Implementation can be complex and resource-intensive.
- Best value often requires broader ServiceNow ecosystem adoption.
- May be too heavy for small engineering-only teams.
Platforms / Deployment
Web / iOS / Android
Cloud
Security & Compliance
ServiceNow typically provides enterprise-grade access control, SSO options, audit logs, encryption, and governance capabilities. Compliance and certification details should be validated based on contract and deployment region.
Integrations & Ecosystem
ServiceNow integrates deeply with enterprise IT, monitoring, cloud, security, asset, and workflow systems. It is strong when RCA must connect technical incidents with business and operational processes.
- Monitoring and observability platforms
- Cloud infrastructure and discovery tools
- CMDB, asset, and configuration systems
- Jira, Slack, Microsoft Teams
- Security operations tools
- APIs, workflow automation, and orchestration
Support & Community
ServiceNow provides enterprise support, implementation partners, training, documentation, and a large ecosystem. Successful adoption usually requires process design and governance planning.
#6 — PagerDuty
Short description:
PagerDuty is an incident management and operations platform that helps teams detect, triage, escalate, respond to, and learn from incidents. While it is not a full observability platform by itself, it plays an important role in RCA by centralizing alerts, response timelines, ownership, service context, and post-incident reviews. It is best for SRE, DevOps, IT operations, and support teams that need structured incident workflows. PagerDuty is especially useful when the challenge is not only finding the root cause, but coordinating the response and preventing repeated incidents.
Key Features
- Alert routing, escalation policies, and on-call scheduling.
- Incident timelines and response orchestration.
- Event intelligence and noise reduction.
- Service ownership and dependency context.
- Runbook and workflow automation.
- Post-incident review and learning workflows.
- Integrations with monitoring, observability, ticketing, and collaboration tools.
Pros
- Strong for incident response coordination and accountability.
- Helps create structured timelines for RCA and postmortems.
- Integrates well with many monitoring and observability tools.
Cons
- Requires external telemetry tools for deep technical investigation.
- Can become noisy if alert rules are poorly designed.
- Advanced automation may require thoughtful setup.
Platforms / Deployment
Web / iOS / Android
Cloud
Security & Compliance
PagerDuty commonly supports enterprise security features such as SSO/SAML, RBAC, audit logs, and encryption. Compliance details should be checked based on plan and procurement requirements.
Integrations & Ecosystem
PagerDuty has a strong incident-management integration ecosystem. It works well as the response layer above monitoring, observability, ITSM, and collaboration tools.
- Datadog, New Relic, Splunk, Dynatrace
- ServiceNow, Jira, Zendesk
- Slack, Microsoft Teams
- AWS, Azure, Google Cloud
- GitHub, GitLab, CI/CD systems
- APIs and workflow automation
Support & Community
PagerDuty offers documentation, support tiers, onboarding resources, and an active operations community. It is widely known among SRE and incident response teams.
#7 — BigPanda
Short description:
BigPanda is an AIOps and event correlation platform designed to reduce alert noise, correlate incidents, and help IT operations teams identify likely root causes faster. It is commonly used in enterprise environments where monitoring tools generate large volumes of alerts from infrastructure, applications, networks, and cloud services. For RCA, BigPanda is useful because it groups related alerts, enriches them with context, and helps teams focus on the actual incident instead of hundreds of symptoms. It is best for large IT operations teams with alert fatigue and complex monitoring environments.
Key Features
- Event correlation and alert noise reduction.
- AIOps-driven incident intelligence.
- Topology and context enrichment.
- Incident prioritization and grouping.
- Integrations with monitoring and ITSM tools.
- Automated routing and workflow support.
- Operational dashboards for incident visibility.
Pros
- Strong for enterprises with high alert volume.
- Helps reduce duplicate and symptom-based alerts.
- Useful bridge between monitoring tools and ITSM workflows.
Cons
- Less useful for teams with low alert volume.
- Requires quality data and integration setup for best results.
- May need tuning to match internal service models.
Platforms / Deployment
Web
Cloud
Security & Compliance
BigPanda supports enterprise-oriented access and governance features, but specific certifications and compliance details should be verified directly. Use “Not publicly stated” where requirements are not confirmed during procurement.
Integrations & Ecosystem
BigPanda integrates with monitoring, observability, cloud, ticketing, and collaboration systems to provide a centralized incident intelligence layer.
- Datadog, New Relic, Dynatrace, Splunk
- ServiceNow and ITSM tools
- Slack and Microsoft Teams
- Cloud monitoring services
- Network and infrastructure monitoring tools
- APIs and event ingestion pipelines
Support & Community
BigPanda provides enterprise support, documentation, onboarding assistance, and customer success resources. Community visibility is stronger in enterprise AIOps and IT operations circles than in open-source communities.
#8 — Grafana Cloud
Short description:
Grafana Cloud is a managed observability platform built around metrics, logs, traces, dashboards, alerting, and open-source observability tools. It is useful for RCA because teams can visualize system behavior, correlate telemetry, monitor infrastructure and applications, and create dashboards that support incident investigation. Grafana Cloud is especially attractive for teams that value open standards, flexible dashboards, Prometheus-style metrics, Loki logs, Tempo traces, and broad data-source connectivity. It fits startups, SMBs, platform teams, and enterprises that prefer flexible observability.
Key Features
- Dashboards for metrics, logs, traces, and operational views.
- Managed Prometheus, Loki, Tempo, and related observability components.
- Alerting and incident context through visual exploration.
- Broad data-source support.
- Kubernetes and infrastructure monitoring.
- OpenTelemetry support.
- Flexible visualization and reporting.
Pros
- Strong dashboarding and open observability ecosystem.
- Good fit for teams already using Prometheus, Loki, or Grafana.
- Flexible and extensible for different RCA workflows.
Cons
- RCA workflows may require more manual dashboard and alert design.
- Less prescriptive than some enterprise AIOps platforms.
- Advanced environments require observability expertise.
Platforms / Deployment
Web
Cloud / Self-hosted / Hybrid
Security & Compliance
Grafana Cloud provides access control and enterprise security options. Specific compliance certifications, data residency, and governance features should be confirmed based on plan and deployment model.
Integrations & Ecosystem
Grafana has a strong ecosystem built around plugins, data sources, APIs, and open observability standards. It is highly adaptable for teams that need custom RCA dashboards.
- Prometheus, Loki, Tempo, Mimir
- OpenTelemetry
- AWS, Azure, Google Cloud
- Kubernetes and container platforms
- Databases and infrastructure tools
- Alerting and collaboration integrations
Support & Community
Grafana has a large open-source community, extensive documentation, community plugins, and commercial support options. Managed support depends on the selected plan.
#9 — Elastic Observability
Short description:
Elastic Observability is part of the Elastic Stack and helps teams analyze logs, metrics, traces, uptime, and application performance data. It is useful for RCA when teams need fast search, flexible analytics, and visibility across application and infrastructure data. Elastic is especially popular with teams that value searchable operational data and want observability connected to log analytics. It fits engineering, IT operations, security, and platform teams that need flexible investigation workflows.
Key Features
- Logs, metrics, traces, uptime, and APM monitoring.
- Search-powered investigation for operational data.
- Dashboards and visualization through Kibana.
- Alerting and anomaly detection capabilities.
- Cloud, Kubernetes, and infrastructure visibility.
- OpenTelemetry and data ingestion support.
- Connection to Elastic security and search ecosystem.
Pros
- Strong log search and flexible data analysis.
- Useful for teams that need custom investigation workflows.
- Can serve both observability and security-adjacent RCA use cases.
Cons
- Requires careful data modeling and retention planning.
- Self-managed deployments need operational expertise.
- Cost and complexity can grow with large data volumes.
Platforms / Deployment
Web
Cloud / Self-hosted / Hybrid
Security & Compliance
Elastic offers enterprise security capabilities such as access control, encryption options, and role-based permissions depending on deployment and subscription. Specific certifications and compliance claims should be verified directly.
Integrations & Ecosystem
Elastic has a broad ingestion and integration ecosystem, making it useful for teams that want to bring many operational data sources into one searchable platform.
- Beats, Elastic Agent, Logstash
- Kubernetes, cloud platforms, infrastructure systems
- OpenTelemetry
- SIEM and security workflows
- Databases, servers, containers, and applications
- APIs and custom ingestion pipelines
Support & Community
Elastic has strong documentation, commercial support, training, and a large open-source community. Support quality depends on subscription and deployment model.
#10 — Sentry
Short description:
Sentry is an application performance monitoring and error tracking platform focused on helping developers identify, prioritize, and fix software issues. For RCA, Sentry is especially strong when the root cause is related to code errors, releases, performance regressions, frontend issues, backend exceptions, or user-impacting bugs. It gives developers stack traces, issue grouping, release context, performance data, and user impact signals. Sentry is best for engineering teams that want developer-first RCA for application defects rather than broad IT operations RCA.
Key Features
- Error tracking with stack traces and issue grouping.
- Performance monitoring for application bottlenecks.
- Release tracking and regression visibility.
- User impact and event context.
- Alerts and workflow routing for developer teams.
- Frontend, backend, mobile, and serverless support.
- Integrations with code repositories and issue trackers.
Pros
- Excellent for developer-focused RCA of software errors.
- Helps connect incidents to releases, commits, and user impact.
- Easier to adopt than broad enterprise observability suites for app debugging.
Cons
- Not a full IT operations or infrastructure RCA platform.
- Less suited for network, hardware, or broad enterprise service mapping.
- Best value comes when teams instrument applications properly.
Platforms / Deployment
Web
Cloud / Self-hosted
Security & Compliance
Sentry provides access control and enterprise security options depending on plan and deployment. Specific certifications and compliance requirements should be verified directly.
Integrations & Ecosystem
Sentry integrates strongly with developer workflows, making it useful when RCA needs to move quickly from error detection to code-level resolution.
- GitHub, GitLab, Bitbucket
- Jira, Linear, Azure DevOps
- Slack, Microsoft Teams
- CI/CD and release workflows
- Frontend, backend, mobile frameworks
- APIs and SDK ecosystem
Support & Community
Sentry has strong developer documentation, SDK support, community adoption, and commercial support options. It is well known among software engineering teams.
Comparison Table Top 10
| Tool Name | Best For | Platform Supported | Deployment | Standout Feature | Public Rating |
|---|---|---|---|---|---|
| Datadog | Cloud-native observability and RCA | Web, iOS, Android | Cloud | Unified metrics, logs, traces, and service maps | N/A |
| Dynatrace | Enterprise AIOps and automated RCA | Web | Cloud / Hybrid | AI-assisted dependency and root cause analysis | N/A |
| New Relic | Developer and DevOps observability | Web, iOS, Android | Cloud | Application-focused troubleshooting and telemetry | N/A |
| Splunk Observability Cloud | Enterprise log-heavy RCA | Web | Cloud / Hybrid | Search and analytics across operational data | N/A |
| ServiceNow IT Operations Management | ITSM-connected enterprise RCA | Web, iOS, Android | Cloud | CMDB, service mapping, and workflow-driven RCA | N/A |
| PagerDuty | Incident response and post-incident learning | Web, iOS, Android | Cloud | Escalation, timelines, and incident orchestration | N/A |
| BigPanda | AIOps alert correlation | Web | Cloud | Noise reduction and event correlation | N/A |
| Grafana Cloud | Open observability dashboards | Web | Cloud / Self-hosted / Hybrid | Flexible dashboards and open telemetry ecosystem | N/A |
| Elastic Observability | Search-driven log and telemetry RCA | Web | Cloud / Self-hosted / Hybrid | Fast search across logs, metrics, and traces | N/A |
| Sentry | Developer-first application RCA | Web | Cloud / Self-hosted | Code-level error tracking and release context | N/A |
Evaluation & Scoring of Root Cause Analysis RCA Tools
| Tool Name | Core 25% | Ease 15% | Integrations 15% | Security 10% | Performance 10% | Support 10% | Value 15% | Weighted Total 0–10 |
|---|---|---|---|---|---|---|---|---|
| Datadog | 9.2 | 8.2 | 9.4 | 8.5 | 8.8 | 8.5 | 7.5 | 8.57 |
| Dynatrace | 9.4 | 7.8 | 8.8 | 8.7 | 9.0 | 8.6 | 7.2 | 8.52 |
| New Relic | 8.7 | 8.5 | 8.8 | 8.2 | 8.5 | 8.2 | 8.0 | 8.45 |
| Splunk Observability Cloud | 8.8 | 7.4 | 8.7 | 8.8 | 8.7 | 8.5 | 7.2 | 8.22 |
| ServiceNow IT Operations Management | 8.6 | 7.2 | 9.0 | 9.0 | 8.3 | 8.7 | 7.0 | 8.17 |
| PagerDuty | 8.0 | 8.6 | 9.2 | 8.5 | 8.3 | 8.5 | 7.8 | 8.39 |
| BigPanda | 8.4 | 7.8 | 8.5 | 8.0 | 8.3 | 8.0 | 7.4 | 8.08 |
| Grafana Cloud | 8.0 | 8.0 | 8.8 | 7.8 | 8.3 | 8.2 | 8.5 | 8.22 |
| Elastic Observability | 8.2 | 7.6 | 8.5 | 8.0 | 8.4 | 8.0 | 8.0 | 8.12 |
| Sentry | 8.0 | 8.8 | 8.2 | 7.8 | 8.4 | 8.2 | 8.5 | 8.28 |
These scores are comparative, not absolute. A higher score does not mean the tool is best for every company. For example, Sentry may score lower than Dynatrace for enterprise-wide RCA but may be the best choice for application error investigation. Similarly, ServiceNow may be ideal for ITSM-heavy organizations even if it requires more implementation effort. Buyers should use this table as a shortlist guide, then validate fit through demos, pilots, integration testing, and security review.
Which Root Cause Analysis RCA Tools Tool Is Right for You?
Solo / Freelancer
Solo developers and freelancers usually need RCA tools that are simple, affordable, and easy to configure. Sentry is a strong choice for application error tracking, release-related issues, and code-level debugging. Grafana Cloud can also work well if the user is comfortable with dashboards, metrics, and lightweight observability. Avoid complex enterprise platforms unless the project has serious uptime, compliance, or customer-impact requirements.
SMB
SMBs should prioritize ease of use, fast setup, predictable pricing, and practical integrations. New Relic, Datadog, Sentry, and Grafana Cloud are strong options depending on whether the main need is application monitoring, infrastructure visibility, error tracking, or dashboard-based investigation. SMBs should avoid overbuying enterprise AIOps features before their incident volume justifies them.
Mid-Market
Mid-market teams often need a balance between observability depth, alert management, collaboration, and cost control. Datadog, New Relic, PagerDuty, Elastic Observability, and Grafana Cloud are practical choices. If alert fatigue becomes a serious issue, BigPanda may help by correlating related alerts and reducing noise. The best approach is often to combine observability with incident response workflows.
Enterprise
Enterprises usually need scalable RCA across applications, infrastructure, networks, business services, ITSM, and compliance workflows. Dynatrace, Datadog, Splunk Observability Cloud, ServiceNow IT Operations Management, and BigPanda are strong enterprise options. PagerDuty is also valuable as an incident response layer. Enterprises should focus heavily on governance, data retention, SSO, RBAC, audit logs, integration depth, and service ownership mapping.
Budget vs Premium
Budget-conscious teams should consider Grafana Cloud, Elastic Observability, and Sentry, especially when they have technical teams capable of configuring dashboards and instrumentation. Premium buyers that want deeper automation, enterprise support, and AIOps should evaluate Dynatrace, Datadog, Splunk, ServiceNow, and BigPanda. The right decision depends on whether you want flexibility and lower entry cost or a more managed enterprise experience.
Feature Depth vs Ease of Use
If feature depth is the priority, Dynatrace, Datadog, Splunk, and ServiceNow offer broad capabilities. If ease of use is more important, Sentry, New Relic, and PagerDuty may be easier for focused use cases. Grafana Cloud is flexible but works best when the team understands observability design. Buyers should avoid choosing the deepest tool if the team does not have time to configure and maintain it properly.
Integrations & Scalability
For integration-heavy environments, Datadog, PagerDuty, ServiceNow, Splunk, and Dynatrace are strong candidates. Teams using open standards may prefer Grafana Cloud, Elastic Observability, or New Relic with OpenTelemetry. Scalability should be judged not only by technical capacity but also by pricing model, data retention, ingestion volume, and operational overhead.
Security & Compliance Needs
Security-conscious buyers should prioritize SSO, MFA, RBAC, encryption, audit logs, data residency, retention controls, and vendor compliance documentation. ServiceNow, Splunk, Dynatrace, Datadog, and PagerDuty are commonly considered for enterprise governance needs. However, buyers should verify certifications and compliance claims directly before procurement. If compliance is strict, avoid relying only on marketing pages and request formal documentation from vendors.
Frequently Asked Questions FAQs
1. What is a Root Cause Analysis RCA tool?
A Root Cause Analysis RCA tool helps teams identify the underlying reason behind a problem instead of only fixing the visible symptom. In IT and software environments, this usually means connecting alerts, logs, traces, incidents, infrastructure events, user impact, and recent changes. The goal is to understand what caused the failure, how it spread, and what action can prevent it from happening again. RCA tools are useful for outages, performance issues, bugs, failed deployments, security incidents, and recurring service problems.
2. How are RCA tools different from monitoring tools?
Monitoring tools tell teams that something is wrong, while RCA tools help explain why it happened. Many modern observability platforms include both monitoring and RCA features, so the difference can overlap. A basic monitoring tool may alert you that CPU usage is high, but an RCA workflow may connect that spike to a deployment, database query, service dependency, or configuration change. The best RCA tools combine detection, correlation, investigation, workflow, and prevention.
3. What pricing models are common for RCA tools?
Pricing models vary widely by vendor and product type. Observability platforms may charge based on hosts, data ingestion, events, logs, users, retention, or feature modules. Incident management platforms may charge per user, per team, or by advanced automation features. Enterprise AIOps tools often use custom pricing based on scale and contract needs. Buyers should always model expected data volume and usage growth before selecting a tool.
4. How long does it take to implement an RCA tool?
Implementation time depends on the tool, environment complexity, integrations, and data quality. A developer-focused tool like Sentry can often be adopted quickly for application error tracking. Enterprise tools such as ServiceNow IT Operations Management, Dynatrace, Splunk, or BigPanda may require more planning, service mapping, access control setup, and workflow design. A practical rollout usually starts with one critical service, then expands after dashboards, alerts, and ownership models are validated.
5. What are the most common mistakes when buying RCA tools?
A common mistake is buying a powerful platform without defining the RCA workflow first. Teams may also underestimate data ingestion costs, ignore alert quality, skip service ownership mapping, or fail to connect incidents with postmortems. Another mistake is expecting AI to solve poor instrumentation or messy operational processes. RCA tools work best when teams have clean telemetry, clear escalation paths, reliable integrations, and a culture of blameless learning.
6. Are AI-powered RCA tools reliable?
AI-powered RCA tools can be very helpful for reducing alert noise, identifying correlations, detecting anomalies, and suggesting likely causes. However, AI should be treated as decision support, not a final authority. The quality of results depends on telemetry coverage, historical data, topology accuracy, and integration quality. Teams should validate AI findings during incidents and use human review for business-critical decisions. Strong RCA combines automation with operational judgment.
7. What integrations should an RCA tool support?
A strong RCA tool should integrate with monitoring systems, cloud platforms, CI/CD tools, source code repositories, ITSM systems, incident response tools, and collaboration platforms. Common examples include cloud providers, Kubernetes, GitHub, GitLab, Jira, ServiceNow, Slack, Microsoft Teams, PagerDuty, Datadog, New Relic, and Splunk. The best integrations depend on your workflow. Buyers should test whether the tool can connect alerts, deployments, ownership, tickets, and postmortem data in one investigation flow.
8. Are RCA tools secure enough for enterprise use?
Many enterprise RCA, observability, AIOps, and incident management tools support security controls such as SSO, MFA, RBAC, encryption, audit logs, and permission management. However, compliance details vary by vendor, plan, region, and contract. Enterprises should request formal documentation for SOC 2, ISO 27001, GDPR, HIPAA, or other required standards instead of assuming availability. Security review should also include data retention, access policies, sensitive log handling, and vendor risk assessment.
9. Can RCA tools scale for large organizations?
Yes, many RCA tools are designed for large-scale environments with thousands of services, high-volume telemetry, multi-cloud infrastructure, and distributed teams. However, scalability is not only technical. Teams must also consider cost scalability, alert governance, dashboard ownership, service catalog quality, data retention, and operational processes. Large organizations should run pilots using real production data before committing to a full rollout. A scalable RCA program needs both strong tooling and strong operating discipline.
10. When should a company switch RCA tools?
A company should consider switching RCA tools when the current tool creates too much alert noise, lacks key integrations, cannot scale with data volume, has poor usability, or fails to support post-incident learning. Switching may also make sense after cloud migration, platform modernization, merger activity, or major changes in engineering workflows. Before switching, teams should document what is failing, compare total cost, test integrations, and run a pilot. A poor implementation can make even a good tool look ineffective.
11. What are alternatives to dedicated RCA tools?
Alternatives include monitoring tools, ITSM platforms, spreadsheets, postmortem templates, log analytics tools, business intelligence dashboards, and manual incident reviews. Small teams may start with basic monitoring plus a structured postmortem process. Engineering teams may use error tracking and logs before adopting full observability. Enterprises often need more advanced RCA because manual approaches become slow and inconsistent at scale. The right alternative depends on system complexity, incident frequency, and compliance requirements.
12. Do RCA tools replace postmortems?
No, RCA tools do not replace postmortems. They improve postmortems by providing better timelines, evidence, telemetry, impact analysis, and contributing-factor data. A postmortem is still a human learning process that asks what happened, why it happened, how the team responded, and how recurrence can be prevented. RCA tools provide the evidence, while postmortems turn that evidence into action items, process improvements, engineering fixes, and organizational learning.
Conclusion
Root Cause Analysis RCA tools are now essential for teams operating complex digital systems, cloud platforms, distributed applications, and enterprise IT services. The best tool depends on the problem you are trying to solve. Datadog, Dynatrace, New Relic, and Splunk are strong for observability-led RCA. ServiceNow is best when RCA must connect with ITSM, CMDB, change management, and enterprise workflows. PagerDuty is valuable for incident response timelines, escalation, and post-incident learning. BigPanda helps enterprises reduce alert noise and correlate events. Grafana Cloud, Elastic Observability, and Sentry are strong choices for teams that want flexible, developer-friendly, or open observability approaches. There is no single universal winner. The right decision depends on team size, technical stack, incident volume, compliance needs, budget, and integration requirements. Start by shortlisting three to five tools, run a pilot on real incidents, validate integrations and security requirements, compare operational cost, and choose the platform that helps your team move from reactive firefighting to repeatable prevention.