MOTOSHARE 🚗🏍️
Rent Bikes & Cars Directly from Owners
Motoshare connects vehicle owners with people who need bikes and cars on rent. Owners earn from idle vehicles, and renters get flexible ride options.
Visit Motoshare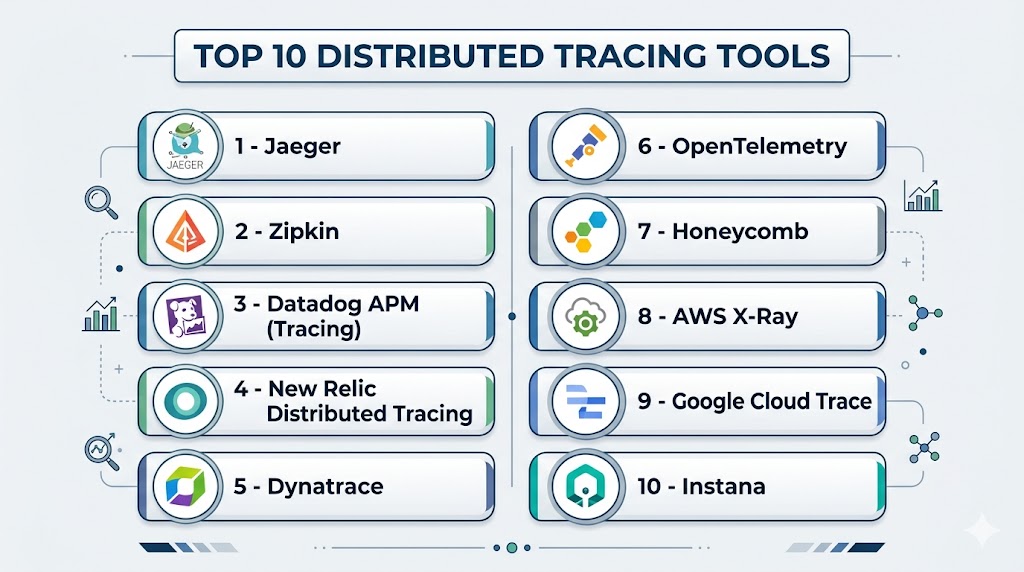
Introduction
In modern architectures powered by microservices, a single user request can travel through dozens of services, APIs, and databases. When something breaks, figuring out where and why becomes incredibly difficult. That’s where Distributed Tracing Tools come in.
These tools track requests as they move across services, giving you a complete end-to-end view of system behavior. Instead of guessing, teams can pinpoint latency, failures, and bottlenecks instantly. Distributed tracing has become a core pillar of observability, especially for cloud-native systems running at scale.
Where distributed tracing tools deliver value:
- Debugging complex microservices architectures
- Identifying latency and performance bottlenecks
- Understanding service dependencies
- Monitoring API and backend performance
- Improving reliability and user experience
What you should evaluate before choosing:
- End-to-end trace visibility
- Support for high-cardinality data
- Integration with logs and metrics
- OpenTelemetry compatibility
- Real-time tracing and analytics
- Scalability for large systems
- Ease of instrumentation
- Visualization and trace exploration
- Security and access controls
- Cost based on data volume
Best for: DevOps teams, SREs, backend engineers, and platform teams managing distributed systems or microservices architectures.
Not ideal for: Monolithic applications or simple systems where request flows are easy to trace manually.
Key Trends in Distributed Tracing Tools
- OpenTelemetry is becoming the standard for instrumentation
- AI-assisted root cause analysis reducing manual debugging
- High-cardinality tracing enabling deeper insights
- Real-time trace analytics for faster incident response
- Tracing + logs + metrics unification into observability platforms
- Kubernetes-native tracing solutions gaining traction
- Sampling optimization techniques to control costs
- Developer-first tracing tools with better UX
- Serverless tracing support expanding rapidly
- Security observability integration linking traces with threat detection
How We Selected These Tools (Methodology)
- Focused on tools with strong adoption in microservices environments
- Evaluated end-to-end tracing capabilities
- Assessed performance at scale (high request volumes)
- Reviewed OpenTelemetry and standards support
- Analyzed integration with observability ecosystems
- Compared ease of instrumentation and setup
- Considered security and compliance readiness
- Included open-source and enterprise tools
- Evaluated community strength and vendor support
- Ensured coverage across startup to enterprise use cases
Top 10 Distributed Tracing Tools
#1 — Jaeger
Short description: A widely used open-source distributed tracing system designed for monitoring and troubleshooting microservices.
Key Features
- End-to-end request tracing
- Service dependency mapping
- Performance monitoring
- Sampling strategies
- OpenTelemetry support
Pros
- Open-source and free
- Strong Kubernetes integration
Cons
- Requires setup and maintenance
- Limited built-in analytics
Platforms / Deployment
Cloud / Self-hosted
Security & Compliance
Varies / Not publicly stated
Integrations & Ecosystem
Jaeger integrates well with modern cloud-native stacks.
- Kubernetes
- OpenTelemetry
- APIs
Support & Community
Strong open-source community.
#2 — Zipkin
Short description: Lightweight distributed tracing tool for tracking request latency across services.
Key Features
- Request tracing
- Latency analysis
- Dependency mapping
- Simple UI
- Sampling support
Pros
- Easy to set up
- Lightweight
Cons
- Limited advanced features
- Basic visualization
Platforms / Deployment
Cloud / Self-hosted
Security & Compliance
Varies / Not publicly stated
Integrations & Ecosystem
- OpenTelemetry
- APIs
- Cloud tools
Support & Community
Active open-source community.
#3 — Datadog APM (Tracing)
Short description: A full-stack observability platform with powerful distributed tracing capabilities.
Key Features
- Distributed tracing
- Real-time analytics
- Service maps
- AI-driven anomaly detection
- Log correlation
Pros
- Unified observability
- Excellent integrations
Cons
- Cost increases with scale
- Requires configuration tuning
Platforms / Deployment
Cloud
Security & Compliance
SSO, RBAC, encryption (others not publicly stated)
Integrations & Ecosystem
- AWS, Azure, GCP
- Kubernetes
- CI/CD tools
Support & Community
Strong enterprise support.
#4 — New Relic Distributed Tracing
Short description: Developer-friendly tracing solution integrated into a full observability platform.
Key Features
- End-to-end tracing
- Real-time performance insights
- Error tracking
- Service maps
- Log correlation
Pros
- Easy to use
- Strong developer experience
Cons
- UI complexity
- Data pricing considerations
Platforms / Deployment
Cloud
Security & Compliance
SSO, RBAC (others not publicly stated)
Integrations & Ecosystem
- Kubernetes
- Cloud platforms
- APIs
Support & Community
Large community and ecosystem.
#5 — Dynatrace
Short description: AI-driven observability platform with automatic distributed tracing capabilities.
Key Features
- Automatic instrumentation
- AI-based root cause analysis
- Service dependency mapping
- Real-time analytics
- Cloud-native support
Pros
- Advanced AI insights
- Minimal manual setup
Cons
- Premium pricing
- Learning curve
Platforms / Deployment
Cloud / Hybrid
Security & Compliance
SSO, RBAC (others not publicly stated)
Integrations & Ecosystem
- Cloud providers
- Kubernetes
- APIs
Support & Community
Enterprise support.
#6 — OpenTelemetry
Short description: An open standard for collecting distributed traces, widely adopted across modern observability tools.
Key Features
- Standardized instrumentation
- Vendor-neutral tracing
- Metrics and logs support
- Flexible pipelines
- Extensible architecture
Pros
- Open standard
- Broad adoption
Cons
- Not a full UI tool
- Requires backend integration
Platforms / Deployment
Self-hosted / Cloud (via integrations)
Security & Compliance
Varies / Not publicly stated
Integrations & Ecosystem
- Jaeger
- Zipkin
- Observability platforms
Support & Community
Very strong community backing.
#7 — Honeycomb
Short description: High-cardinality tracing platform designed for deep debugging of distributed systems.
Key Features
- Event-based tracing
- High-cardinality data analysis
- Real-time querying
- Debugging workflows
- Distributed tracing
Pros
- Excellent for debugging
- Developer-focused
Cons
- Niche use cases
- Learning curve
Platforms / Deployment
Cloud
Security & Compliance
Not publicly stated
Integrations & Ecosystem
- OpenTelemetry
- APIs
Support & Community
Growing ecosystem.
#8 — AWS X-Ray
Short description: Native distributed tracing tool for AWS environments.
Key Features
- Request tracing
- Service maps
- Latency analysis
- AWS service integration
- Real-time insights
Pros
- Deep AWS integration
- Easy setup within AWS
Cons
- Limited outside AWS
- Less flexible
Platforms / Deployment
Cloud
Security & Compliance
RBAC (others not publicly stated)
Integrations & Ecosystem
- AWS services
- APIs
Support & Community
Strong cloud ecosystem support.
#9 — Google Cloud Trace
Short description: Distributed tracing tool for applications running on Google Cloud.
Key Features
- Request tracing
- Latency insights
- Integration with GCP services
- Real-time monitoring
- Visualization tools
Pros
- Seamless GCP integration
- Scalable
Cons
- Limited outside GCP
- Fewer advanced features
Platforms / Deployment
Cloud
Security & Compliance
RBAC (others not publicly stated)
Integrations & Ecosystem
- GCP services
- APIs
Support & Community
Cloud-native support.
#10 — Instana
Short description: Automated observability platform with strong distributed tracing capabilities.
Key Features
- Automatic tracing
- Real-time monitoring
- Dependency mapping
- AI insights
- Kubernetes support
Pros
- Fast setup
- Real-time insights
Cons
- Premium pricing
- Limited customization
Platforms / Deployment
Cloud / Self-hosted
Security & Compliance
SSO, RBAC (others not publicly stated)
Integrations & Ecosystem
- Kubernetes
- Cloud platforms
- APIs
Support & Community
Enterprise support.
Comparison Table (Top 10)
| Tool Name | Best For | Platform(s) Supported | Deployment | Standout Feature | Public Rating |
|---|---|---|---|---|---|
| Jaeger | Open-source tracing | Web | Cloud/Self-hosted | Service mapping | N/A |
| Zipkin | Lightweight tracing | Web | Cloud/Self-hosted | Simplicity | N/A |
| Datadog | Full observability | Web | Cloud | Unified tracing | N/A |
| New Relic | Developer teams | Web | Cloud | Easy tracing | N/A |
| Dynatrace | Enterprise AI tracing | Web | Cloud/Hybrid | AI insights | N/A |
| OpenTelemetry | Standardization | N/A | Hybrid | Vendor-neutral | N/A |
| Honeycomb | Debugging | Web | Cloud | High-cardinality | N/A |
| AWS X-Ray | AWS users | Web | Cloud | AWS integration | N/A |
| Google Cloud Trace | GCP users | Web | Cloud | GCP integration | N/A |
| Instana | Automation | Web | Cloud/Self-hosted | Auto tracing | N/A |
Evaluation & Scoring of Distributed Tracing Tools
| Tool Name | Core | Ease | Integrations | Security | Performance | Support | Value | Weighted Total |
|---|---|---|---|---|---|---|---|---|
| Jaeger | 8 | 7 | 8 | 6 | 8 | 8 | 10 | 8.1 |
| Zipkin | 7 | 8 | 7 | 6 | 7 | 7 | 9 | 7.5 |
| Datadog | 9 | 7 | 10 | 8 | 9 | 9 | 7 | 8.6 |
| New Relic | 9 | 8 | 9 | 8 | 9 | 9 | 8 | 8.8 |
| Dynatrace | 10 | 7 | 9 | 9 | 10 | 9 | 6 | 8.8 |
| OpenTelemetry | 8 | 6 | 10 | 6 | 8 | 9 | 10 | 8.2 |
| Honeycomb | 8 | 7 | 7 | 7 | 8 | 7 | 7 | 7.6 |
| AWS X-Ray | 8 | 8 | 7 | 7 | 8 | 8 | 8 | 7.9 |
| Google Cloud Trace | 8 | 8 | 7 | 7 | 8 | 8 | 8 | 7.9 |
| Instana | 9 | 8 | 8 | 8 | 9 | 8 | 7 | 8.3 |
How to interpret scores:
These scores are comparative, not absolute. Higher scores indicate stronger overall capabilities across weighted criteria. Enterprise teams may prioritize AI and automation, while smaller teams may focus on cost and ease of use.
Which Distributed Tracing Tool Is Right for You?
Solo / Freelancer
Use Zipkin or Jaeger for simple and cost-effective tracing.
SMB
New Relic or Instana provide strong features with ease of use.
Mid-Market
Datadog or OpenTelemetry-based stacks offer scalability and flexibility.
Enterprise
Dynatrace and Datadog deliver advanced automation and insights.
Budget vs Premium
- Budget: Jaeger, Zipkin
- Premium: Dynatrace, Datadog
Feature Depth vs Ease of Use
- Advanced: Dynatrace, Honeycomb
- Easy: New Relic, AWS X-Ray
Integrations & Scalability
Datadog and OpenTelemetry lead in ecosystem flexibility.
Security & Compliance Needs
Choose tools with RBAC, encryption, and audit capabilities.
Frequently Asked Questions (FAQs)
1. What is distributed tracing?
It tracks requests across multiple services to understand system behavior.
2. Why is it important?
It helps identify performance bottlenecks and failures in complex systems.
3. What is OpenTelemetry?
An open standard for collecting traces, metrics, and logs.
4. Is distributed tracing expensive?
Costs depend on data volume and sampling strategies.
5. Do all tools support microservices?
Yes, distributed tracing is designed for microservices.
6. What is trace sampling?
Collecting a subset of traces to reduce data volume.
7. Can tracing integrate with logs?
Yes, most tools support correlation with logs and metrics.
8. What are common mistakes?
Over-collecting data without proper sampling.
9. Can startups use tracing tools?
Yes, many open-source options exist.
10. Is tracing secure?
Security depends on the platform’s controls and configurations.
Conclusion
Distributed tracing tools have become a critical capability for modern software teams operating in complex, microservices-driven environments where a single request can span multiple services and systems. These tools provide the visibility needed to understand system behavior, identify bottlenecks, and resolve issues quickly before they impact users. From open-source solutions like Jaeger and Zipkin to advanced enterprise platforms like Dynatrace and Datadog, each tool offers unique strengths tailored to different use cases and scales. The best choice depends on your architecture, team expertise, and observability goals rather than a single universal winner. A practical next step is to shortlist a few tools, test them within your environment, and evaluate how effectively they improve debugging speed, system visibility, and overall performance reliability.
Good comparison of distributed tracing tools. One key gap is handling high-cardinality data and keeping traces consistent across microservices and legacy systems in real production setups.
A practical gap is instrumentation governance. Without clear span naming standards, context propagation checks, and limits on high-cardinality tags, traces can become inconsistent, expensive, and hard to trust during real production incide