MOTOSHARE 🚗🏍️
Rent Bikes & Cars Directly from Owners
Motoshare connects vehicle owners with people who need bikes and cars on rent. Owners earn from idle vehicles, and renters get flexible ride options.
Visit Motoshare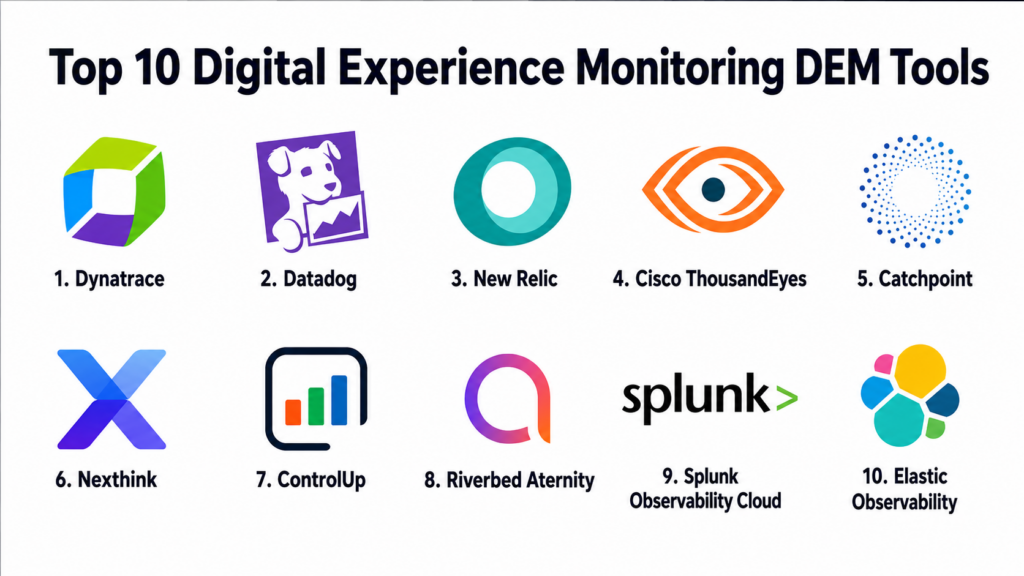
Introduction
Digital Experience Monitoring DEM platforms help organizations measure, analyze, and improve the real user experience across applications, websites, mobile apps, endpoints, networks, cloud services, APIs, and digital workflows. In simple terms, DEM helps IT, DevOps, SRE, product, and support teams understand whether users are getting a fast, reliable, and smooth digital experience.DEM matters because users now access business services from many locations, devices, browsers, networks, and cloud environments. A website may be online but still slow for users in one region. An employee app may work in the data center but fail over home Wi-Fi. A SaaS platform may appear healthy while users experience login delays, API errors, or frontend slowness.Real world use cases include real user monitoring, synthetic monitoring, endpoint experience tracking, SaaS application performance, network path visibility, mobile app monitoring, customer journey analysis, and digital workplace monitoring.
Buyers should evaluate RUM depth, synthetic testing, endpoint monitoring, network visibility, AI insights, session replay, alert quality, integrations, security controls, scalability, reporting, and ease of use.
Best for: Digital Experience Monitoring platforms are best for IT operations teams, DevOps teams, SRE teams, application owners, product teams, customer experience teams, digital workplace teams, and enterprises that need visibility into user experience across applications and infrastructure.
Not ideal for: DEM may not be necessary for very small teams with simple websites, low traffic, limited digital services, or basic uptime monitoring needs. In those cases, basic website monitoring, infrastructure monitoring, or simple analytics tools may be enough.
Key Trends in Digital Experience Monitoring DEM
- Real user monitoring is becoming essential: Teams want to understand actual user sessions, browser performance, mobile app behavior, frontend errors, and geographic experience differences.
- Synthetic monitoring is expanding: Businesses use scripted tests to detect issues before real users complain, especially for login flows, checkout pages, APIs, and core transactions.
- Endpoint experience is growing: DEM now includes employee device performance, Wi-Fi quality, application responsiveness, VPN issues, and digital workplace productivity.
- AI-assisted root cause analysis: Platforms are using AI to connect user complaints with backend services, network paths, cloud dependencies, and recent changes.
- Full-stack correlation is important: Buyers want DEM connected with APM, logs, traces, infrastructure metrics, network telemetry, and incident response workflows.
- Network and internet visibility matter more: Cloud apps, SaaS tools, CDNs, DNS, ISPs, and remote users make network path monitoring important for experience analysis.
- Session replay and journey analytics are becoming common: Teams want to visually understand where users struggle, abandon workflows, or experience errors.
- SaaS experience monitoring is rising: Enterprises want visibility into Microsoft 365, Salesforce, ServiceNow, Zoom, Teams, and other critical SaaS applications.
- Privacy and governance are stronger buying factors: DEM tools may collect user behavior, session data, device data, and performance telemetry, so masking and access controls matter.
- Business impact reporting is improving: Teams increasingly connect experience metrics with revenue, conversion, employee productivity, support tickets, and customer satisfaction.
How We Selected These Tools
The tools in this list were selected based on their relevance to digital experience monitoring, real user monitoring, synthetic testing, endpoint experience, network visibility, application performance, and user journey analytics.
Selection logic included:
- Recognition in DEM, observability, APM, endpoint experience, or network experience monitoring.
- Ability to monitor real users, synthetic transactions, applications, endpoints, and digital workflows.
- Strength of full-stack correlation across frontend, backend, infrastructure, network, and cloud services.
- Support for web, mobile, SaaS, employee experience, and customer-facing digital services.
- Integration with ITSM, DevOps, incident management, collaboration, and observability systems.
- Reporting depth for performance, availability, user journeys, errors, and experience scores.
- AI and automation capabilities for alerting, anomaly detection, and root cause investigation.
- Security controls such as RBAC, SSO, audit logs, encryption, and privacy governance.
- Fit across SMB, mid-market, enterprise, DevOps, IT operations, and digital workplace teams.
- Overall value for improving reliability, reducing outages, and understanding real user impact.
Top 10 Digital Experience Monitoring DEM Tools
1- Dynatrace
Short description:
Dynatrace is a full-stack observability and digital experience monitoring platform that helps teams monitor user experience across web, mobile, applications, cloud services, infrastructure, and business journeys. It is widely used by enterprises that need strong AI-assisted root cause analysis and frontend-to-backend visibility. Dynatrace supports real user monitoring, synthetic monitoring, session replay, application performance monitoring, and infrastructure observability. It is best suited for organizations with complex digital services and high reliability expectations.
Key Features
- Real user monitoring for web and mobile applications.
- Synthetic monitoring for browsers, APIs, and key workflows.
- Session replay and user journey analysis.
- AI-assisted root cause analysis.
- Full-stack observability across apps, infrastructure, and cloud.
- Business impact and conversion analysis.
- Integration with DevOps, ITSM, and incident workflows.
Pros
- Strong full-stack correlation from user experience to backend systems.
- Useful AI-driven analysis for complex environments.
- Good fit for enterprise observability and DEM programs.
Cons
- May be more advanced than smaller teams need.
- Requires careful setup to get full value from advanced features.
- Cost and complexity should be evaluated for large telemetry volumes.
Platforms / Deployment
Web
Cloud / Hybrid options may vary
Security & Compliance
Dynatrace provides enterprise security capabilities such as role-based access, SSO options, audit logs, encryption, and data governance controls. Specific certifications and compliance coverage should be validated during procurement.
Integrations & Ecosystem
Dynatrace integrates with cloud platforms, DevOps tools, incident systems, CI/CD pipelines, collaboration tools, and ITSM workflows. Its value increases when DEM data is connected to backend traces, infrastructure metrics, and business events.
- Cloud platforms
- Kubernetes and container systems
- ITSM tools
- CI/CD platforms
- Incident management tools
- Collaboration platforms
Support & Community
Dynatrace provides documentation, training resources, support services, professional services, and a mature observability community. Enterprise support options are available, but successful adoption benefits from strong internal ownership.
2- Datadog
Short description:
Datadog is a cloud observability platform with strong digital experience monitoring capabilities through real user monitoring, synthetic monitoring, session replay, mobile monitoring, frontend error tracking, and backend correlation. It is especially useful for DevOps, SRE, product, and engineering teams that want DEM connected with logs, metrics, traces, infrastructure, and security signals. Datadog is well suited for cloud-native and fast-moving software teams. It helps teams identify whether user experience issues come from frontend code, APIs, infrastructure, or third-party dependencies.
Key Features
- Real user monitoring for web and mobile apps.
- Synthetic browser and API testing.
- Session replay and frontend error tracking.
- Correlation with APM, logs, infrastructure, and traces.
- Dashboards for Core Web Vitals and user experience metrics.
- Alerting and anomaly detection.
- Integration with DevOps and incident response workflows.
Pros
- Strong observability ecosystem for engineering teams.
- Excellent correlation between frontend and backend telemetry.
- Flexible dashboards and integrations.
Cons
- Cost management may require attention as telemetry grows.
- Large environments need careful tagging and governance.
- Non-technical users may need training for advanced workflows.
Platforms / Deployment
Web
Cloud
Security & Compliance
Datadog provides enterprise security controls such as SSO, RBAC, audit trails, encryption, and administrative governance. Specific compliance coverage depends on product scope, region, and contract.
Integrations & Ecosystem
Datadog has a broad ecosystem across cloud, DevOps, incident response, monitoring, security, and collaboration tools. DEM works especially well when connected with APM and infrastructure monitoring.
- AWS, Azure, and Google Cloud
- Kubernetes and containers
- CI/CD tools
- Incident management systems
- Collaboration tools
- Logs, traces, and infrastructure monitoring
Support & Community
Datadog provides documentation, customer support, learning resources, community content, and partner support. Its community is strong among DevOps, SRE, platform engineering, and cloud operations teams.
3- New Relic
Short description:
New Relic is an observability platform with digital experience monitoring capabilities across browser monitoring, mobile monitoring, synthetic monitoring, APM, infrastructure, logs, and user journey analysis. It helps teams understand how users experience applications and how frontend performance connects with backend services. New Relic is useful for engineering, product, DevOps, and SRE teams that want a unified observability experience. It is a strong fit for organizations looking for DEM with application performance and business context.
Key Features
- Browser monitoring and real user visibility.
- Mobile app monitoring.
- Synthetic monitoring for critical workflows.
- APM and distributed tracing correlation.
- Frontend error and performance analysis.
- Dashboards for user experience and application health.
- Integration with DevOps and incident response tools.
Pros
- Strong application-centric DEM visibility.
- Useful for engineering teams tracking user experience and backend performance together.
- Flexible observability platform for modern applications.
Cons
- Requires good instrumentation and tagging practices.
- Advanced analysis may need observability expertise.
- Cost and data ingest should be planned carefully.
Platforms / Deployment
Web
Cloud
Security & Compliance
New Relic provides enterprise security controls such as user permissions, SSO options, audit capabilities, encryption, and administrative governance. Specific compliance coverage should be validated based on contract and deployment requirements.
Integrations & Ecosystem
New Relic integrates with cloud platforms, CI/CD systems, incident tools, collaboration platforms, and open telemetry workflows. Its DEM capabilities are strongest when linked with application and infrastructure telemetry.
- Cloud providers
- OpenTelemetry workflows
- CI/CD systems
- Incident management tools
- Collaboration platforms
- Logs, traces, and infrastructure data
Support & Community
New Relic provides documentation, support resources, community forums, learning content, and customer success options. Its ecosystem is strong among developers, SRE teams, and observability practitioners.
4- Cisco ThousandEyes
Short description:
Cisco ThousandEyes is a digital experience and network intelligence platform that helps organizations monitor user experience across networks, internet paths, cloud services, SaaS applications, APIs, and enterprise locations. It is especially strong when experience problems are caused by DNS, ISP, CDN, cloud, WAN, or external network dependencies. ThousandEyes is widely used by enterprises that need visibility beyond their own infrastructure. It is best suited for network, IT operations, and digital experience teams managing distributed users and cloud applications.
Key Features
- Internet, WAN, and cloud path visibility.
- Synthetic monitoring for web, API, and network tests.
- Endpoint agent visibility for user experience.
- SaaS application and service availability monitoring.
- Network path visualization and dependency analysis.
- Alerts for performance and availability problems.
- Integration with incident and operations workflows.
Pros
- Excellent visibility into external network and internet dependencies.
- Strong fit for distributed enterprises and SaaS-heavy environments.
- Helps identify whether issues are internal, ISP, cloud, or third-party related.
Cons
- Less focused on deep application code-level monitoring than APM tools.
- Best value depends on network and endpoint coverage.
- May require complementary APM for backend application diagnostics.
Platforms / Deployment
Web
Cloud
Security & Compliance
Cisco ThousandEyes provides enterprise security and administrative controls. Specific compliance coverage, access controls, and data protection details should be validated during procurement.
Integrations & Ecosystem
ThousandEyes integrates with Cisco networking, incident response, collaboration, observability, and IT operations workflows. It is especially useful for connecting network experience data with service reliability processes.
- Cisco ecosystem tools
- ITSM systems
- Incident management tools
- Collaboration platforms
- Network operations workflows
- Cloud and SaaS monitoring use cases
Support & Community
Cisco provides enterprise support, documentation, training resources, and a large technical ecosystem. ThousandEyes is particularly strong among network operations and digital experience teams.
5- Catchpoint
Short description:
Catchpoint is a digital experience monitoring platform focused on internet performance, synthetic monitoring, real user monitoring, network experience, endpoint visibility, and service reliability. It helps teams monitor how users experience applications from different geographies, networks, devices, and internet paths. Catchpoint is especially useful for organizations where external dependencies such as DNS, CDN, cloud, API, and ISP performance strongly affect user experience. It is best suited for SRE, IT operations, network, and digital service reliability teams.
Key Features
- Synthetic monitoring from global locations.
- Real user monitoring and experience analytics.
- Internet and network path visibility.
- API, DNS, CDN, and web performance monitoring.
- Endpoint and workforce experience monitoring.
- Alerting and performance reporting.
- Service reliability dashboards.
Pros
- Strong external digital experience and internet performance visibility.
- Useful for global customer-facing applications.
- Good fit for SRE and operations teams focused on reliability.
Cons
- May require complementary APM tools for deep backend code diagnostics.
- Advanced setup may require careful test design.
- Best value depends on monitoring locations and business-critical workflows.
Platforms / Deployment
Web
Cloud
Security & Compliance
Catchpoint provides enterprise access and administrative controls for monitoring workflows. Specific certifications, compliance scope, and data protection practices should be validated during procurement.
Integrations & Ecosystem
Catchpoint integrates with incident response, ITSM, observability, collaboration, and operations systems. It is valuable when DEM data must support fast incident detection and service reliability decisions.
- Incident management tools
- ITSM systems
- Collaboration platforms
- Observability platforms
- API monitoring workflows
- Network operations processes
Support & Community
Catchpoint provides documentation, support, customer success resources, and reliability-focused educational content. Its community is strongest among SRE, network operations, and digital performance teams.
6- Nexthink
Short description:
Nexthink is a digital employee experience platform focused on monitoring and improving employee technology experience across devices, applications, networks, and workplace services. It helps IT teams understand how employees experience digital tools, identify endpoint issues, detect productivity problems, and automate remediation. Nexthink is especially useful for large organizations with distributed employees and complex digital workplace environments. It is best suited for IT teams that care about employee experience, endpoint health, and proactive support.
Key Features
- Digital employee experience monitoring.
- Endpoint performance and device health visibility.
- Application usage and responsiveness insights.
- Employee sentiment and feedback capabilities.
- Automated remediation workflows.
- SaaS and workplace technology experience analysis.
- Dashboards for IT and employee experience teams.
Pros
- Strong focus on employee digital experience.
- Useful for proactive IT support and endpoint visibility.
- Helps connect technical performance with employee productivity.
Cons
- Less focused on external customer-facing web performance.
- Requires endpoint deployment and experience data governance.
- Best suited for organizations with meaningful employee device scale.
Platforms / Deployment
Web
Cloud
Security & Compliance
Nexthink provides enterprise security and administrative controls such as access management, role-based permissions, and data governance options. Specific compliance coverage should be validated during procurement.
Integrations & Ecosystem
Nexthink integrates with ITSM, endpoint management, collaboration, and automation tools. It is especially useful when employee experience data needs to trigger proactive IT workflows.
- ITSM platforms
- Endpoint management systems
- Collaboration tools
- Automation workflows
- Digital workplace tools
- Reporting and analytics systems
Support & Community
Nexthink provides documentation, customer support, training resources, customer success services, and digital employee experience guidance. Its community is strong among enterprise IT and digital workplace leaders.
7- ControlUp
Short description:
ControlUp is a digital employee experience and IT operations platform focused on endpoint, virtual desktop, SaaS, and remote work experience monitoring. It is especially useful for organizations using virtual desktop infrastructure, remote work environments, and distributed endpoints. ControlUp helps IT teams detect performance issues, identify root causes, and automate remediation actions. It is best suited for EUC, IT operations, and digital workplace teams managing employee experience at scale.
Key Features
- Digital employee experience monitoring.
- Endpoint and virtual desktop visibility.
- Real-time performance analytics.
- Remote work and SaaS experience insights.
- Automated remediation actions.
- Dashboards for user, device, and application health.
- Monitoring for VDI and EUC environments.
Pros
- Strong fit for virtual desktop and employee experience teams.
- Useful for remote work troubleshooting.
- Provides actionable endpoint and user experience insights.
Cons
- Less focused on public website or customer journey monitoring.
- Best value depends on endpoint and EUC environment scale.
- May require complementary tools for application code-level observability.
Platforms / Deployment
Web
Cloud / Hybrid options may vary
Security & Compliance
ControlUp provides security and administrative controls for endpoint and experience monitoring workflows. Specific compliance certifications and data handling details should be validated during procurement.
Integrations & Ecosystem
ControlUp integrates with ITSM, endpoint management, virtualization platforms, collaboration tools, and automation workflows. It is particularly valuable in environments where VDI and endpoint experience are business critical.
- Virtual desktop platforms
- Endpoint management tools
- ITSM systems
- Collaboration platforms
- Automation workflows
- Digital workplace systems
Support & Community
ControlUp provides documentation, support, training, customer success resources, and EUC-focused expertise. Its community is strong among VDI, endpoint, and digital workplace professionals.
8- Riverbed Aternity
Short description:
Riverbed Aternity is a digital experience management platform focused on employee experience, endpoint performance, application performance, and business productivity visibility. It helps IT teams understand how applications and devices perform from the user perspective. Aternity is especially useful for enterprises that need digital employee experience monitoring across distributed workforces. It helps organizations identify slow devices, poor application response, network issues, and user-impacting technology problems.
Key Features
- End-user experience monitoring.
- Endpoint and application performance visibility.
- Digital employee experience analytics.
- User productivity and experience scoring.
- Device health and application responsiveness insights.
- Business impact reporting.
- Integration with IT operations and service workflows.
Pros
- Strong focus on employee experience and endpoint visibility.
- Useful for enterprise digital workplace monitoring.
- Helps prioritize IT issues based on user impact.
Cons
- Less focused on public web synthetic monitoring.
- Requires endpoint data collection and governance.
- May need complementary observability tools for backend diagnostics.
Platforms / Deployment
Web
Cloud / Hybrid options may vary
Security & Compliance
Riverbed Aternity provides enterprise access controls and data governance capabilities for experience monitoring workflows. Specific certifications and compliance coverage should be validated during procurement.
Integrations & Ecosystem
Aternity integrates with ITSM, endpoint management, network monitoring, and digital workplace tools. It is useful when employee experience data must support support tickets and operational decisions.
- ITSM platforms
- Endpoint management tools
- Network monitoring tools
- Digital workplace systems
- Reporting platforms
- Automation workflows
Support & Community
Riverbed provides enterprise support, documentation, professional services, and customer success resources. Aternity’s ecosystem is strongest among enterprise IT operations and digital workplace teams.
9- Splunk Observability Cloud
Short description:
Splunk Observability Cloud provides application, infrastructure, log, trace, synthetic, and real user monitoring capabilities for teams that need full-stack visibility. Its DEM value comes from combining user-facing performance signals with backend telemetry and incident analytics. Splunk is especially useful for organizations that already rely on Splunk for operations, security, or observability. It is best suited for teams that want digital experience data connected with broader operational intelligence.
Key Features
- Real user monitoring and frontend visibility.
- Synthetic monitoring for critical user flows.
- APM, logs, metrics, and traces.
- Infrastructure and cloud monitoring.
- Alerting and incident workflow support.
- Dashboards for service and user experience.
- Integration with Splunk data and analytics ecosystem.
Pros
- Strong fit for organizations already using Splunk.
- Good full-stack observability coverage.
- Useful for connecting experience data with operational analytics.
Cons
- May require observability expertise to manage effectively.
- Cost and data volume should be planned carefully.
- Employee endpoint experience may require complementary tools.
Platforms / Deployment
Web
Cloud
Security & Compliance
Splunk provides enterprise security controls such as access management, role-based permissions, audit features, and data governance capabilities. Specific compliance coverage should be validated based on product and contract.
Integrations & Ecosystem
Splunk integrates with cloud platforms, DevOps tools, ITSM systems, incident workflows, logs, metrics, and security systems. It is especially useful when organizations want DEM connected with broader machine data and operational intelligence.
- Cloud platforms
- ITSM tools
- Incident management tools
- DevOps pipelines
- Logs and metrics systems
- Security operations workflows
Support & Community
Splunk provides documentation, training, support services, community resources, and partner assistance. Its community is strong among observability, security, and IT operations teams.
10- Elastic Observability
Short description:
Elastic Observability provides logs, metrics, traces, uptime monitoring, synthetic monitoring, real user monitoring, and application visibility using the Elastic ecosystem. It helps teams understand application performance, frontend behavior, infrastructure health, and service reliability. Elastic is especially useful for technical teams that want flexible observability and search-powered analytics. It can fit organizations that prefer open, customizable monitoring workflows and strong data exploration.
Key Features
- Real user monitoring for frontend applications.
- Synthetic monitoring and uptime checks.
- APM and distributed tracing.
- Logs, metrics, and infrastructure monitoring.
- Search and analytics powered by Elastic.
- Dashboards and alerting workflows.
- Flexible deployment and data exploration options.
Pros
- Flexible observability platform for technical teams.
- Strong search and analytics capabilities.
- Useful for teams already using Elastic for logs or search.
Cons
- Requires technical expertise for advanced setup and tuning.
- User experience features may need configuration to match business needs.
- Cost and storage planning are important at scale.
Platforms / Deployment
Web
Cloud / Self-managed options may vary
Security & Compliance
Elastic provides security features such as role-based access, encryption options, authentication controls, and audit capabilities depending on deployment and subscription. Specific compliance coverage should be validated during procurement.
Integrations & Ecosystem
Elastic integrates with cloud systems, applications, infrastructure, Kubernetes, logs, metrics, traces, and alerting workflows. It is useful when teams want a flexible observability stack with DEM capabilities.
- Cloud platforms
- Kubernetes and containers
- Application telemetry
- Logs and metrics systems
- Alerting workflows
- DevOps tools
Support & Community
Elastic provides documentation, community forums, support plans, training resources, and partner assistance. Its community is strong among developers, DevOps teams, search practitioners, and observability engineers.
Comparison Table Top 10
| Tool Name | Best For | Platform Supported | Deployment | Standout Feature | Public Rating |
|---|---|---|---|---|---|
| Dynatrace | Enterprise full-stack DEM and observability | Web | Cloud / Hybrid options may vary | AI-assisted user-to-backend root cause analysis | N/A |
| Datadog | Cloud-native DevOps and SRE teams | Web | Cloud | RUM, synthetic, session replay, and APM correlation | N/A |
| New Relic | Application-focused DEM and observability | Web | Cloud | Browser, mobile, synthetic, and APM visibility | N/A |
| Cisco ThousandEyes | Network and internet experience visibility | Web | Cloud | Internet, WAN, cloud, and SaaS path monitoring | N/A |
| Catchpoint | Global digital service reliability | Web | Cloud | Synthetic and internet performance monitoring | N/A |
| Nexthink | Digital employee experience monitoring | Web | Cloud | Employee device and workplace experience analytics | N/A |
| ControlUp | Endpoint, VDI, and remote work experience | Web | Cloud / Hybrid options may vary | Real-time EUC and endpoint experience insights | N/A |
| Riverbed Aternity | Enterprise employee experience management | Web | Cloud / Hybrid options may vary | End-user device and application experience scoring | N/A |
| Splunk Observability Cloud | Splunk-centered observability teams | Web | Cloud | DEM connected with logs, metrics, traces, and analytics | N/A |
| Elastic Observability | Flexible technical observability teams | Web | Cloud / Self-managed options may vary | Search-powered observability with RUM and synthetic monitoring | N/A |
Evaluation and Scoring of Digital Experience Monitoring DEM
The scoring below is comparative and based on DEM depth, ease of use, integrations, security posture signals, performance, support expectations, and value. These are not public ratings and should be used as directional evaluation scores only. A platform with a lower score may still be the best choice if it solves your exact digital experience problem.
| Tool Name | Core 25% | Ease 15% | Integrations 15% | Security 10% | Performance 10% | Support 10% | Value 15% | Weighted Total 0–10 |
|---|---|---|---|---|---|---|---|---|
| Dynatrace | 10 | 8 | 9 | 9 | 9 | 9 | 7 | 8.80 |
| Datadog | 9 | 8 | 10 | 9 | 9 | 8 | 8 | 8.75 |
| New Relic | 8 | 8 | 9 | 8 | 8 | 8 | 8 | 8.15 |
| Cisco ThousandEyes | 9 | 8 | 8 | 9 | 9 | 9 | 7 | 8.45 |
| Catchpoint | 9 | 8 | 8 | 8 | 9 | 8 | 8 | 8.40 |
| Nexthink | 9 | 8 | 8 | 9 | 8 | 8 | 7 | 8.25 |
| ControlUp | 8 | 8 | 8 | 8 | 8 | 8 | 8 | 8.00 |
| Riverbed Aternity | 8 | 7 | 8 | 8 | 8 | 8 | 7 | 7.70 |
| Splunk Observability Cloud | 8 | 7 | 9 | 9 | 8 | 8 | 7 | 7.95 |
| Elastic Observability | 8 | 7 | 8 | 8 | 8 | 8 | 8 | 7.85 |
These scores should be interpreted based on your use case. Dynatrace, Datadog, New Relic, Splunk, and Elastic are strong when DEM must connect with full-stack observability. ThousandEyes and Catchpoint are especially strong when network, internet, SaaS, and external dependency visibility are critical. Nexthink, ControlUp, and Riverbed Aternity are stronger for employee experience and endpoint-focused DEM. Buyers should validate tools using real applications, real regions, real devices, and real user journeys.
Which Digital Experience Monitoring DEM Tool Is Right for You?
Solo / Freelancer
Solo professionals usually do not need a large DEM platform. Basic uptime monitoring, website analytics, browser performance tools, and simple synthetic checks may be enough. If the freelancer manages client websites or SaaS apps, Elastic Observability, New Relic, or a lightweight monitoring setup may help. The goal should be to track uptime, page speed, user errors, and critical workflows without creating unnecessary complexity.
SMB
SMBs should prioritize ease of setup, clear dashboards, affordable monitoring, and fast issue detection. New Relic, Datadog, Elastic Observability, and Catchpoint can be practical depending on the team’s technical maturity. If the company mainly monitors customer-facing web apps, RUM and synthetic monitoring should be the first priority. If employee experience is the concern, ControlUp or Nexthink may be more relevant.
Mid-Market
Mid-market organizations often need stronger integrations, multi-region monitoring, alerting, frontend-to-backend correlation, and business journey visibility. Datadog, Dynatrace, New Relic, Catchpoint, ThousandEyes, and Elastic can be strong choices depending on the stack. If the main issue is internet or SaaS reliability, ThousandEyes or Catchpoint may fit better. If engineering teams need observability and DEM together, Datadog, Dynatrace, New Relic, Splunk, or Elastic may be better.
Enterprise
Enterprises need scalable DEM across applications, employees, endpoints, networks, cloud, SaaS, and business-critical digital services. Dynatrace, Datadog, ThousandEyes, Catchpoint, Nexthink, Splunk, and Riverbed Aternity are strong enterprise candidates. Enterprises should evaluate security, data residency, integrations, privacy controls, user data masking, alert governance, role-based access, and reporting. The best enterprise DEM strategy may include more than one platform for application, network, and employee experience use cases.
Budget vs Premium
Budget-focused teams should start with the most important monitoring type first. For customer-facing apps, start with RUM and synthetic monitoring. For internal employees, start with endpoint experience monitoring. Premium platforms such as Dynatrace, Datadog, ThousandEyes, Nexthink, and Catchpoint provide deeper capabilities but require stronger governance and budget planning. Buyers should compare license cost, data ingest, test volume, endpoint agents, support, and implementation effort.
Feature Depth vs Ease of Use
Feature depth matters when teams need session replay, real user monitoring, synthetic tests, network path visibility, endpoint telemetry, full-stack traces, and business analytics. Dynatrace, Datadog, ThousandEyes, Catchpoint, and Nexthink provide strong depth in different areas. Ease of use matters when teams need quick adoption and simple dashboards. New Relic, ControlUp, and some Elastic-based setups may be practical depending on team skills and requirements.
Integrations and Scalability
DEM becomes more powerful when it integrates with APM, logs, traces, ITSM, incident management, collaboration, CI/CD, cloud platforms, and customer support systems. A slow checkout page, failed login, or SaaS outage should create actionable alerts and connect to the right team. Buyers should test integrations with tools already used by engineering, IT, network, and support teams. Scalability also matters because DEM can generate large volumes of user, session, and synthetic test data.
Security and Compliance Needs
DEM platforms may collect session data, user actions, endpoint details, device data, network paths, application traces, and performance telemetry. Buyers should evaluate SSO, MFA, RBAC, audit logs, encryption, privacy masking, session replay controls, data retention, and regional data handling. Sensitive fields such as passwords, payment data, personal data, and confidential user inputs should be masked or excluded. Security and privacy review should happen before broad deployment.
Frequently Asked Questions FAQs
1. What is Digital Experience Monitoring DEM?
Digital Experience Monitoring DEM is the practice of measuring how users experience digital services such as websites, mobile apps, SaaS tools, internal portals, and employee applications. It looks beyond server uptime and focuses on speed, availability, errors, journeys, devices, networks, and user satisfaction. DEM helps teams understand whether users are actually having a good experience. It is useful for IT, DevOps, SRE, product, and digital workplace teams.
2. How is DEM different from traditional monitoring?
Traditional monitoring often focuses on infrastructure health, server uptime, CPU, memory, logs, and backend services. DEM focuses on the user’s actual digital experience, including page load time, transaction success, frontend errors, endpoint performance, network paths, and application responsiveness. A system can appear healthy while users still face slow pages or failed transactions. DEM closes that visibility gap by monitoring from the user perspective.
3. What pricing models are common for DEM platforms?
DEM platforms commonly price by monitored users, sessions, page views, synthetic tests, endpoints, data volume, features, or enterprise contract size. Observability platforms may charge based on data ingest, hosts, traces, or usage. Employee experience tools may price by endpoint or employee count. Buyers should ask about RUM volume, session replay costs, synthetic test frequency, data retention, alerting, integrations, and support. Total cost can grow if telemetry is not governed carefully.
4. How long does DEM implementation usually take?
Implementation time depends on application count, monitoring scope, endpoint deployment, synthetic test design, integrations, and privacy review. A basic website RUM setup may be faster than enterprise DEM across apps, devices, networks, and SaaS tools. Teams should start with critical user journeys such as login, search, checkout, payment, or employee access. After that, they can expand to session replay, endpoint experience, business dashboards, and automated remediation.
5. What are common mistakes when choosing a DEM platform?
A common mistake is choosing a DEM tool without defining which experience problem matters most. Some teams need web RUM, others need synthetic testing, endpoint experience, SaaS visibility, or network path analysis. Another mistake is collecting too much telemetry without clear dashboards or ownership. Teams also fail when alerts are noisy or not tied to business impact. A good DEM rollout should start with critical journeys and clear success metrics.
6. Are DEM platforms secure?
DEM platforms can be secure when configured with strong access controls, encryption, masking, role-based permissions, and audit logs. However, they may collect sensitive information such as user behavior, session details, device data, and application context. Session replay requires special care because it can accidentally capture personal or confidential data if masking is not configured properly. Buyers should involve security, privacy, legal, and compliance teams before full deployment.
7. Can DEM tools integrate with observability and ITSM platforms?
Yes, many DEM tools integrate with APM, logs, traces, infrastructure monitoring, ITSM, incident management, collaboration, and DevOps systems. These integrations help teams move from user complaint to root cause faster. For example, a slow transaction can be linked to a backend trace, a network issue, or a recent deployment. ITSM integration also helps create tickets automatically. Buyers should test integrations during a pilot.
8. What is the difference between RUM and synthetic monitoring?
Real User Monitoring RUM collects performance and behavior data from actual users using real browsers, devices, locations, and networks. Synthetic monitoring uses scripted tests that simulate user actions from selected locations at scheduled intervals. RUM shows what real users experienced, while synthetic monitoring can detect issues before users are affected. A strong DEM strategy often uses both. Together, they provide better visibility into availability, speed, and user journeys.
9. What alternatives exist if a full DEM platform is not needed?
Alternatives include basic uptime monitoring, website analytics, browser performance reports, infrastructure monitoring, application logs, simple synthetic checks, and customer support feedback. These can work for small teams or low-risk websites. However, they may not show complete user journeys, endpoint problems, network paths, or frontend-to-backend root causes. A full DEM platform becomes valuable when digital services are business-critical. The right alternative depends on traffic, complexity, and support expectations.
10. How should buyers evaluate DEM tools?
Buyers should evaluate real user monitoring, synthetic testing, endpoint monitoring, session replay, network visibility, integrations, alerting, privacy controls, scalability, and reporting. They should test the tool with real applications, real journeys, and real user locations. It is also important to check how well the platform connects frontend experience with backend services and infrastructure. A focused pilot should include login flows, transaction paths, mobile users, remote employees, and key business dashboards.
Conclusion
Digital Experience Monitoring DEM platforms help organizations understand and improve the real experience users have with applications, websites, SaaS services, endpoints, networks, and digital workflows. The best tool depends on whether the main priority is customer-facing application performance, employee experience, network path visibility, synthetic monitoring, session replay, or full-stack observability. Dynatrace, Datadog, New Relic, Splunk, and Elastic are strong when DEM must connect with broader observability. ThousandEyes and Catchpoint are strong for network, internet, and external dependency visibility. Nexthink, ControlUp, and Riverbed Aternity are strong for digital employee experience and endpoint-focused monitoring. There is no single best platform for every organization because digital experience depends on business model, user type, application architecture, network complexity, and operational maturity. The practical next step is to shortlist three to five tools, define your most critical user journeys, run a pilot with real traffic and synthetic tests, validate security and privacy controls, and compare how quickly each platform helps your team detect, explain, and resolve user-impacting problems.
