MOTOSHARE 🚗🏍️
Rent Bikes & Cars Directly from Owners
Motoshare connects vehicle owners with people who need bikes and cars on rent. Owners earn from idle vehicles, and renters get flexible ride options.
Visit Motoshare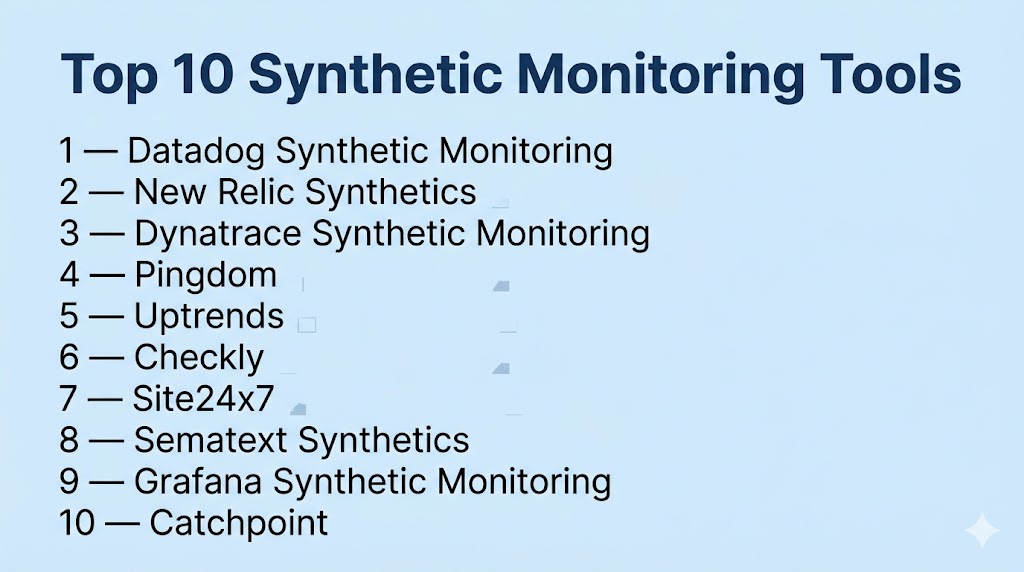
Introduction
Waiting for users to report issues is not monitoring—it’s damage control.
Synthetic Monitoring Tools flip that model completely. Instead of reacting to problems, they actively simulate user behavior—testing your application 24/7 across locations, devices, and networks to catch issues before they become outages.
In modern systems where downtime means lost revenue and broken trust, synthetic monitoring acts as your always-on quality gate. It continuously validates uptime, performance, and critical user flows—even when no real users are active.
If something breaks at 3 AM, you don’t want a user telling you—you want your system already fixing it.
Where synthetic monitoring delivers real impact:
- Detecting downtime before users notice
- Testing login flows, checkout journeys, and APIs
- Monitoring global performance across regions
- Validating deployments and releases
- Enforcing SLAs and SLOs
What you should evaluate before choosing:
- Browser and API synthetic testing
- Global testing nodes and geo-coverage
- Scripted user journeys (multi-step flows)
- Real-time alerting and incident detection
- CI/CD pipeline integration
- Scalability for frequent checks
- Ease of scripting or no-code setup
- Reporting and visualization
- Security and access controls
- Pricing (per test, per run, or usage-based)
Best for: DevOps teams, SREs, QA engineers, and platform teams who want zero surprises in production.
Not ideal for: Teams relying only on passive monitoring or low-criticality systems.
Key Trends in Synthetic Monitoring Tools
- Shift to proactive reliability engineering (prevent, not detect)
- AI-driven alerting reducing noise and false positives
- Scriptless and low-code testing lowering adoption barriers
- CI/CD integration becoming standard for release validation
- Global test networks expanding for real-world simulation
- API-first monitoring as backend systems dominate
- Synthetic + RUM convergence for full user visibility
- Serverless execution models reducing infrastructure overhead
- Continuous testing pipelines replacing manual QA checks
- Monitoring tied directly to SLAs, SLOs, and business KPIs
How We Selected These Tools (Methodology)
- Focused on tools trusted in production environments
- Evaluated depth of synthetic testing (browser + API)
- Assessed global coverage and execution reliability
- Reviewed alerting speed and accuracy
- Analyzed integration with CI/CD and DevOps pipelines
- Compared ease of scripting vs no-code workflows
- Considered security and compliance readiness
- Included developer-first and enterprise-grade tools
- Evaluated community and vendor support
- Ensured coverage across SMB to enterprise use cases
Top 10 Synthetic Monitoring Tools
#1 — Datadog Synthetic Monitoring
Short description: A full-stack synthetic monitoring powerhouse that connects simulated tests directly with real backend performance insights.
Key Features
- Browser and API testing
- Multi-step user journey simulation
- Global testing locations
- CI/CD pipeline integration
- Real-time alerts
- Performance analytics
Pros
- Deep integration with observability stack
- Highly scalable
Cons
- Costs grow with usage
- Requires tuning
Platforms / Deployment
Web / Cloud
Security & Compliance
SSO, RBAC, encryption (others not publicly stated)
Integrations & Ecosystem
Datadog connects synthetic tests to real backend issues for faster debugging.
- AWS, Azure, GCP
- CI/CD tools
- APIs
Support & Community
Strong enterprise support.
#2 — New Relic Synthetics
Short description: A developer-friendly synthetic monitoring solution built for fast setup and strong DevOps integration.
Key Features
- Scripted browser monitoring
- API and endpoint testing
- Global monitoring locations
- Alerting and dashboards
- Integration with APM
Pros
- Easy onboarding
- Strong ecosystem
Cons
- UI learning curve
- Usage-based pricing
Platforms / Deployment
Web / Cloud
Security & Compliance
SSO, RBAC (others not publicly stated)
Integrations & Ecosystem
- Kubernetes
- APIs
- DevOps tools
Support & Community
Large developer community.
#3 — Dynatrace Synthetic Monitoring
Short description: Enterprise-grade synthetic monitoring powered by AI for automatic issue detection and root cause analysis.
Key Features
- Browser and API testing
- AI-driven anomaly detection
- Global monitoring
- Real-time alerts
- Observability integration
Pros
- Advanced automation
- Enterprise scalability
Cons
- Premium pricing
- Complex setup
Platforms / Deployment
Cloud / Hybrid
Security & Compliance
SSO, RBAC (others not publicly stated)
Integrations & Ecosystem
- Cloud platforms
- Kubernetes
- APIs
Support & Community
Enterprise-level support.
#4 — Pingdom
Short description: A simple, reliable synthetic monitoring tool focused on uptime and performance checks.
Key Features
- Uptime monitoring
- Page speed testing
- Global checkpoints
- Alerting system
- Performance reports
Pros
- Extremely easy to use
- Fast setup
Cons
- Limited advanced workflows
- Not ideal for complex apps
Platforms / Deployment
Cloud
Security & Compliance
Not publicly stated
Integrations & Ecosystem
- APIs
- Web tools
Support & Community
Moderate support.
#5 — Uptrends
Short description: A robust synthetic monitoring platform offering deep transaction monitoring and global coverage.
Key Features
- Multi-location testing
- Transaction monitoring
- API monitoring
- Performance analytics
- Alerts and reporting
Pros
- Strong global reach
- Detailed insights
Cons
- Learning curve
- Pricing complexity
Platforms / Deployment
Cloud
Security & Compliance
Not publicly stated
Integrations & Ecosystem
- APIs
- DevOps tools
Support & Community
Good support resources.
#6 — Checkly
Short description: A modern synthetic monitoring tool built for developers with CI/CD-first workflows.
Key Features
- API and browser testing
- JavaScript-based scripting
- CI/CD integration
- Real-time alerts
- Monitoring dashboards
Pros
- Developer-friendly
- Strong automation
Cons
- Requires coding
- Smaller ecosystem
Platforms / Deployment
Cloud
Security & Compliance
Not publicly stated
Integrations & Ecosystem
- CI/CD tools
- APIs
Support & Community
Growing adoption.
#7 — Site24x7
Short description: An all-in-one monitoring platform with strong synthetic capabilities for SMBs.
Key Features
- Website monitoring
- API testing
- Global locations
- Alerts and reports
- Performance tracking
Pros
- Affordable
- Broad feature set
Cons
- UI complexity
- Limited scripting depth
Platforms / Deployment
Cloud
Security & Compliance
Not publicly stated
Integrations & Ecosystem
- Cloud tools
- APIs
Support & Community
Strong SMB adoption.
#8 — Sematext Synthetics
Short description: A lightweight synthetic monitoring solution focused on simplicity and performance tracking.
Key Features
- API and browser monitoring
- Performance tracking
- Alerts and dashboards
- Global locations
- Integration with logs
Pros
- Cost-effective
- Easy setup
Cons
- Limited enterprise features
- Smaller ecosystem
Platforms / Deployment
Cloud
Security & Compliance
Not publicly stated
Integrations & Ecosystem
- APIs
- Monitoring tools
Support & Community
Growing ecosystem.
#9 — Grafana Synthetic Monitoring
Short description: A flexible synthetic monitoring solution designed for teams already using Grafana.
Key Features
- Synthetic probes
- API monitoring
- Global testing
- Alerts
- Dashboard visualization
Pros
- Open-source-friendly
- Highly flexible
Cons
- Requires setup
- Limited advanced features
Platforms / Deployment
Cloud / Self-hosted
Security & Compliance
RBAC (others not publicly stated)
Integrations & Ecosystem
- Grafana
- Prometheus
- APIs
Support & Community
Strong open-source ecosystem.
#10 — Catchpoint
Short description: A premium synthetic monitoring platform built for large-scale digital experience monitoring.
Key Features
- Global monitoring nodes
- User journey simulation
- Performance analytics
- Real-time alerts
- Network insights
Pros
- Best-in-class global coverage
- Advanced analytics
Cons
- Expensive
- Enterprise-focused
Platforms / Deployment
Cloud
Security & Compliance
Not publicly stated
Integrations & Ecosystem
- APIs
- Enterprise tools
Support & Community
Enterprise-grade support.
Comparison Table (Top 10)
| Tool Name | Best For | Platform(s) Supported | Deployment | Standout Feature | Public Rating |
|---|---|---|---|---|---|
| Datadog | Full-stack monitoring | Web | Cloud | End-to-end testing | N/A |
| New Relic | Dev teams | Web | Cloud | Easy scripting | N/A |
| Dynatrace | Enterprise AI | Web | Cloud/Hybrid | AI automation | N/A |
| Pingdom | Websites | Web | Cloud | Simplicity | N/A |
| Uptrends | Global testing | Web | Cloud | Multi-location | N/A |
| Checkly | DevOps teams | Web | Cloud | CI/CD integration | N/A |
| Site24x7 | SMB | Web | Cloud | All-in-one | N/A |
| Sematext | Budget teams | Web | Cloud | Cost-effective | N/A |
| Grafana | Open-source | Web | Cloud/Self-hosted | Flexibility | N/A |
| Catchpoint | Enterprise | Web | Cloud | Global network | N/A |
Evaluation & Scoring of Synthetic Monitoring Tools
| Tool Name | Core | Ease | Integrations | Security | Performance | Support | Value | Weighted Total |
|---|---|---|---|---|---|---|---|---|
| Datadog | 9 | 7 | 10 | 8 | 9 | 9 | 7 | 8.6 |
| New Relic | 9 | 8 | 9 | 8 | 9 | 9 | 8 | 8.8 |
| Dynatrace | 10 | 7 | 9 | 9 | 10 | 9 | 6 | 8.8 |
| Pingdom | 7 | 9 | 7 | 6 | 7 | 7 | 8 | 7.6 |
| Uptrends | 8 | 7 | 8 | 7 | 8 | 8 | 7 | 7.8 |
| Checkly | 8 | 8 | 8 | 6 | 8 | 7 | 7 | 7.8 |
| Site24x7 | 8 | 7 | 8 | 7 | 8 | 8 | 8 | 8.0 |
| Sematext | 7 | 8 | 7 | 6 | 7 | 7 | 8 | 7.4 |
| Grafana | 8 | 7 | 8 | 6 | 8 | 8 | 9 | 8.0 |
| Catchpoint | 9 | 6 | 8 | 8 | 9 | 9 | 6 | 8.1 |
How to interpret scores:
These scores are comparative, not absolute. A higher score reflects stronger overall capability across weighted criteria. Enterprises should prioritize scale and analytics, while smaller teams should focus on simplicity and cost.
Which Synthetic Monitoring Tool Is Right for You?
Solo / Freelancer
Go with Pingdom or Sematext for simplicity.
SMB
Choose Site24x7 or Checkly for balanced features.
Mid-Market
Datadog or New Relic offer scalability and integration depth.
Enterprise
Dynatrace and Catchpoint deliver advanced analytics and global reach.
Budget vs Premium
- Budget: Grafana, Sematext
- Premium: Dynatrace, Datadog
Feature Depth vs Ease of Use
- Advanced: Dynatrace, Catchpoint
- Easy: Pingdom, Site24x7
Integrations & Scalability
Datadog and New Relic lead in ecosystem strength.
Security & Compliance Needs
Prioritize tools with RBAC and encryption.
Frequently Asked Questions (FAQs)
1. What is synthetic monitoring?
It simulates user behavior to proactively test application performance.
2. Why is it important?
Because it catches issues before users experience them.
3. How is it different from RUM?
Synthetic uses simulated tests; RUM uses real users.
4. Can it monitor APIs?
Yes, API monitoring is a core feature.
5. Is it expensive?
Depends on test frequency and coverage.
6. Does it integrate with CI/CD?
Yes, most modern tools do.
7. What are common mistakes?
Running too many tests without cost control.
8. Can startups use it?
Yes, many tools offer affordable tiers.
9. Is it real-time?
Yes, alerts are typically real-time.
10. Can it prevent downtime?
Yes, by detecting issues early.
Conclusion
Synthetic monitoring tools have evolved into a core pillar of modern reliability engineering by enabling teams to move from reactive troubleshooting to proactive issue prevention, ensuring applications remain consistently available, fast, and reliable across all environments and user conditions. As systems become more distributed and user expectations continue to rise, the ability to simulate real user journeys and detect failures before they impact customers provides a critical advantage in maintaining performance and trust. The tools covered in this guide range from simple, easy-to-use solutions for basic uptime checks to enterprise-grade platforms offering advanced analytics, automation, and global testing capabilities, each suited for different levels of complexity and scale. There is no single best tool—only the one that aligns with your infrastructure, team maturity, and monitoring strategy. The most effective next step is to shortlist a few options, run controlled tests, and evaluate how well they help you prevent incidents, improve performance, and deliver a seamless user experience.
Good overview of synthetic monitoring tools. One thing missing is the real maintenance effort—scripts often break with UI/API changes, and alert noise can become a big issue in production if not properly tuned.
A practical gap is synthetic test maintainability. As user flows change, scripts can become flaky or outdated, so teams should version tests with application code, manage test credentials safely, and review false positives regularly to keep alerts trusted in production.